Daly City: Fire Incidents, California (CA)
Where are fire incidents reported in Daly City, CA
Something went wrong! Please refresh the page.
| Fire incidents reported | |
|---|---|
| Sreet name | Count |
| MISSION ST | 160 |
| 280 | 138 |
| PONCETTA DR | 108 |
| JOHN DALY BLVD | 100 |
| GELLERT BLVD | 94 |
| JUNIPERO SERRA BLVD | 68 |
| CALLAN BLVD | 60 |
| SKYLINE DR | 58 |
| LAKE MERCED BLVD | 54 |
| CAMPUS DR | 50 |
| SOUTHGATE AV | 50 |
| ACCACIA ST | 48 |
| CORONADO AV | 48 |
| ORIENTE ST | 48 |
| HILLSIDE BLVD | 44 |
| SERRAMONTE SHOPPIN CTR | 44 |
| SOUTHGATE AVE | 44 |
| PARK PLAZA DR | 42 |
| MAYFAIR AV | 38 |
| PRICE ST | 38 |
| SYLVAN ST | 38 |
| WESTLAKE CTR | 38 |
| WESTLINE DR | 36 |
| CANTERBURY AV | 34 |
| 1 | 32 |
| BELLEVUE AV | 32 |
| BRUNSWICK ST | 32 |
| GUADALUPE CANYON PKWY | 32 |
| HICKEY BLVD | 32 |
| KING DR | 32 |
| Other | 811 |
2005 - 2018 National Fire Incident Reporting System (NFIRS) incidents
- Incident types reported to NFIRS in Daly City, CA
- 19,99762.7%Rescue & EMS
- 3,21710.1%Good Intent Call
- 2,5508.0%Hazardous Condition
- 2,4837.8%Fire
- 2,0966.6%Service Call
- 1,4654.6%False Alarm
- 420.1%Overpressure Rupture
- Fire incident types reported to NFIRS in Daly City, CA
- 1,40156.4%Structure Fires
- 61824.9%Outside Fires
- 37014.9%Mobile Property/Vehicle Fires
- 943.8%Other
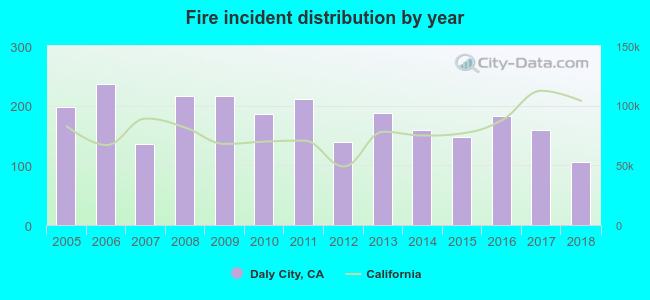 According to the data from the years 2005 - 2018 the average number of fires per year is 177. The highest number of fires - 237 took place in 2006, and the least - 106 in 2018. The data has a dropping trend.
The average number of yearly fire incidents per 10k residents in Daly City, CA compared to nearest cities:
(Note: Based on data for the last 3 years, including only cities with population 5,000 and above)
| Daly City: | 14.1 |
| South San Francisco: | 19.8 |
| Pacifica: | 20.9 |
| San Francisco: | 36.6 |
| San Bruno: | 22.9 |
| Millbrae: | 25.4 |
| Burlingame: | 17.3 |
| Hillsborough: | 12.6 |
| Sausalito: | 79.4 |
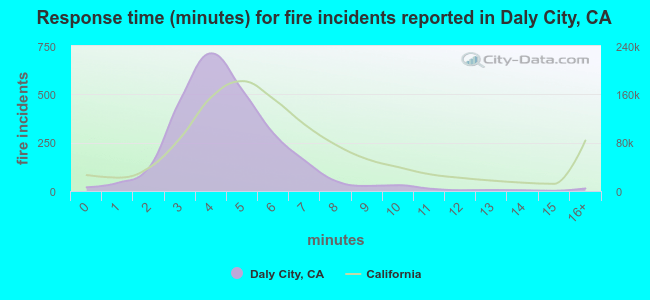 The median response time based on all reported fire incidents is 4 minutes. This is lower than the state median value.
The median response time in Daly City, CA compared to nearest cities:
(Note: Based on data for all years, including only cities with at least 500 fire incidents)
| Daly City: | 4 minutes |
| South San Francisco: | 4 minutes |
| Brisbane: | 5 minutes |
| Pacifica: | 5 minutes |
| San Francisco: | 4 minutes |
| San Bruno: | 4 minutes |
| Millbrae: | 4 minutes |
| Burlingame: | 4 minutes |
| Sausalito: | 6 minutes |
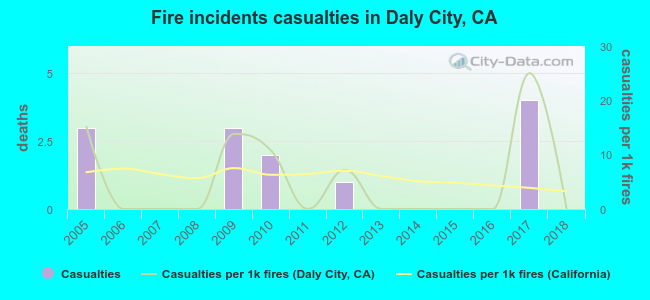 Based on the reports from the years 2005 - 2018 the average number of fire-related casualties per year is 1. The highest number of injuries - 4 took place in 2017, and the lowest - 0 in 2006. The data has a decreasing trend.
The average number of casualties per 1,000 fires is 5. This indicator was the highest - 25 in 2017, and the lowest 0 in 2006. The trend for injuries per 1,000 fire incidents is dropping. Compared to the California value the number of casualties per 1,000 incidents is similar.
Based on the reports from the years 2005 - 2018 the average number of fire-related casualties per year is 1. The highest number of injuries - 4 took place in 2017, and the lowest - 0 in 2006. The data has a decreasing trend.
The average number of casualties per 1,000 fires is 5. This indicator was the highest - 25 in 2017, and the lowest 0 in 2006. The trend for injuries per 1,000 fire incidents is dropping. Compared to the California value the number of casualties per 1,000 incidents is similar.Casualties per 1,000 incidents in Daly City, CA compared to nearest cities:
(Note: Based on data for all years, including only cities with at least 500 fire incidents)
| Daly City: | 5.2 |
| South San Francisco: | 7.0 |
| Brisbane: | 2.9 |
| Pacifica: | 5.2 |
| San Francisco: | 5.9 |
| San Bruno: | 6.8 |
| Millbrae: | 2.1 |
| Burlingame: | 4.7 |
| Sausalito: | 5.5 |
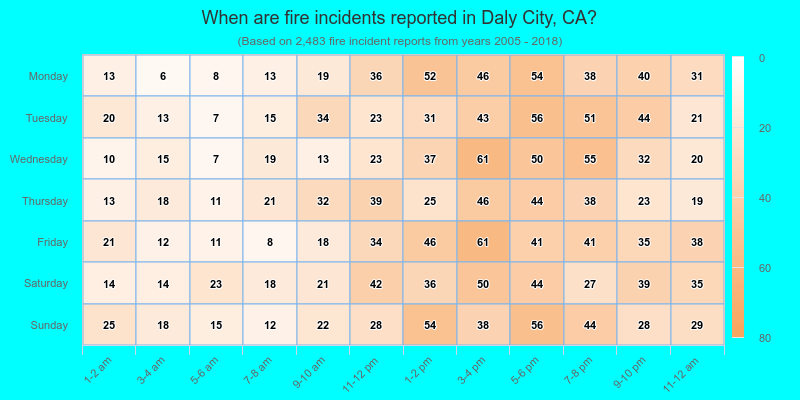
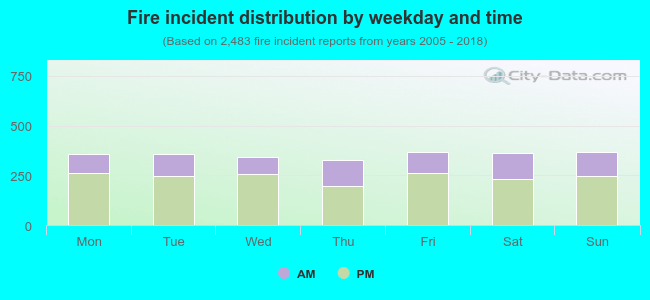 31.6% incidents where reported in the morning and 68.4% in the evening. The most fires (14.9%) took place on Sunday, and the least (13.3%) on Thursday.
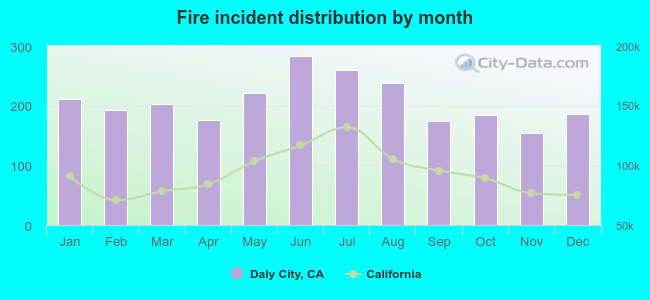 Based on the 2,483 reports from years 2005 - 2018 most fires (11.4%) took place during June, and the least (6.2%) in November.
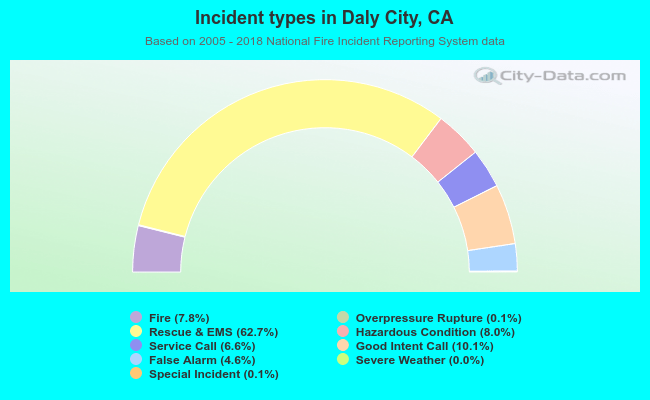 Out of all 31,888 cases reported during the years 2005 - 2018, the most belonged to the categories: Rescue & EMS (62.7%), Good Intent Call (10.1%), and Hazardous Condition (8.0%).
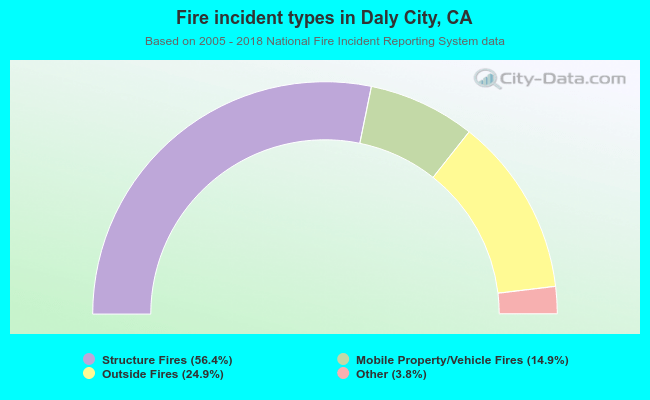 When looking into fire subcategories, the most reports belonged to: Structure Fires (56.4%), and Outside Fires (24.9%).