Shafter: Fire Incidents, California (CA)
Where are fire incidents reported in Shafter, CA
Something went wrong! Please refresh the page.
| Fire incidents reported | |
|---|---|
| Sreet name | Count |
| LERDO HWY | 54 |
| RODRIGUEZ AV | 52 |
| ASH AV | 46 |
| SHAFTER AV | 42 |
| 99 SOUTH HWY | 26 |
| EUCLID AV | 26 |
| SHAFTER | 26 |
| CENTRAL VALLEY HWY | 22 |
| ASH | 20 |
| LOS ANGELES ST | 20 |
| MAYER LN | 20 |
| TULARE AV | 20 |
| 99 NORTH HWY | 16 |
| CENTRAL AV | 16 |
| GOLDEN WEST AV | 16 |
| KLASSEN DR | 16 |
| ZERKER RD | 16 |
| RIVERSIDE ST | 14 |
| ELM ST | 12 |
| FABER ST | 12 |
| JAMES ST | 12 |
| MARENGO ST | 12 |
| OLSON AV | 12 |
| ORANGE ST | 12 |
| RODRIGUEZ | 12 |
| SCARONI AV | 12 |
| TULARE | 12 |
| WALKER ST | 12 |
| WALL ST | 12 |
| ATLANTIC AV | 10 |
| Other | 173 |
2002 - 2018 National Fire Incident Reporting System (NFIRS) incidents
- Incident types reported to NFIRS in Shafter, CA
- 3,09355.6%Rescue & EMS
- 78314.1%Fire
- 76813.8%Good Intent Call
- 4448.0%Hazardous Condition
- 2614.7%Service Call
- 2093.8%False Alarm
- Fire incident types reported to NFIRS in Shafter, CA
- 32441.4%Outside Fires
- 29637.8%Structure Fires
- 15619.9%Mobile Property/Vehicle Fires
- 70.9%Other
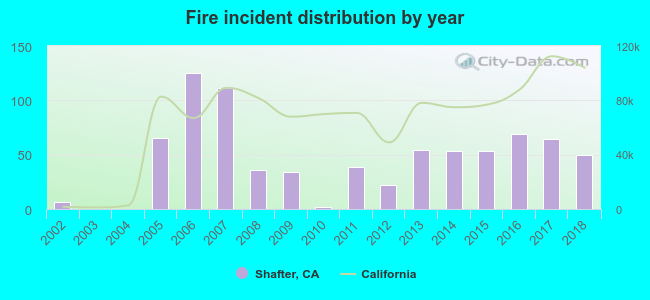 According to the data from the years 2002 - 2018 the average number of fires per year is 46. The highest number of fire incidents - 125 took place in 2006, and the least - 0 in 2003. The data has a rising trend.
The average number of yearly fire incidents per 10k residents in Shafter, CA compared to nearest cities:
(Note: Based on data for the last 3 years, including only cities with population 5,000 and above)
| Shafter: | 34.7 |
| Rosedale: | 1.1 |
| Wasco: | 30.0 |
| Greenacres: | 11.4 |
| McFarland: | 32.1 |
| Oildale: | 38.1 |
| Bakersfield: | 64.4 |
| Delano: | 26.3 |
| Lamont: | 28.2 |
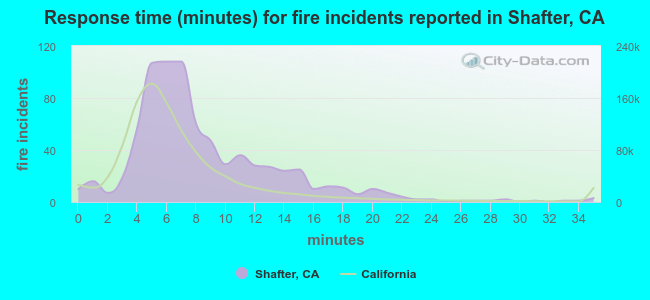 The median response time based on all reported fire incidents is 7 minutes. This is comparable to the state median value.
The median response time in Shafter, CA compared to nearest cities:
(Note: Based on data for all years, including only cities with at least 500 fire incidents)
| Shafter: | 7 minutes |
| Wasco: | 7 minutes |
| Oildale: | 6 minutes |
| Bakersfield: | 7 minutes |
| Delano: | 7 minutes |
| Lamont: | 7 minutes |
| Earlimart: | 8 minutes |
| Taft: | 6 minutes |
| Arvin: | 7 minutes |
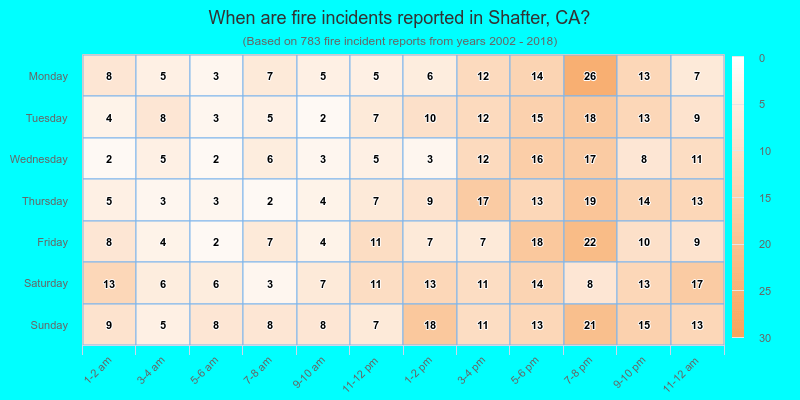
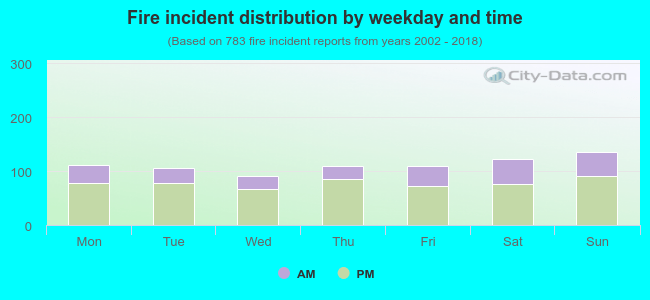 30.1% incidents where reported in the morning and 69.9% in the evening. The most fires (17.4%) took place on Sunday, and the least (11.5%) on Wednesday.
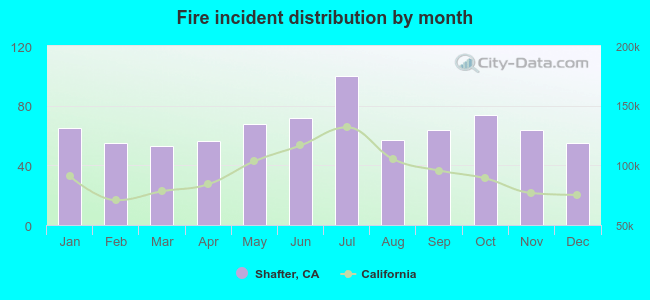 According to the 783 incident reports from years 2002 - 2018 most fires (12.8%) took place during July, and the least (6.8%) in March.
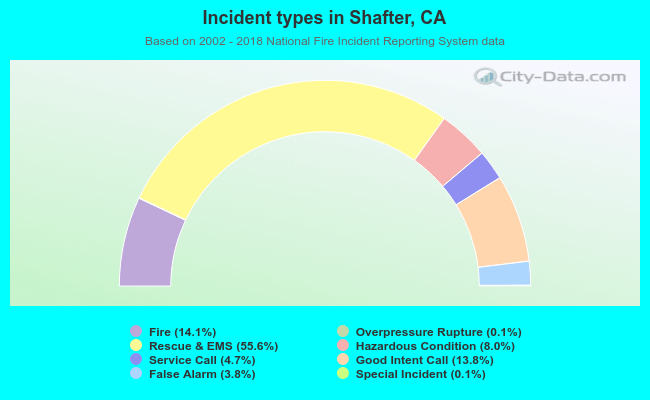 Out of all 5,566 cases reported during the years 2002 - 2018, the most belonged to the categories: Rescue & EMS (55.6%), Fire (14.1%), and Good Intent Call (13.8%).
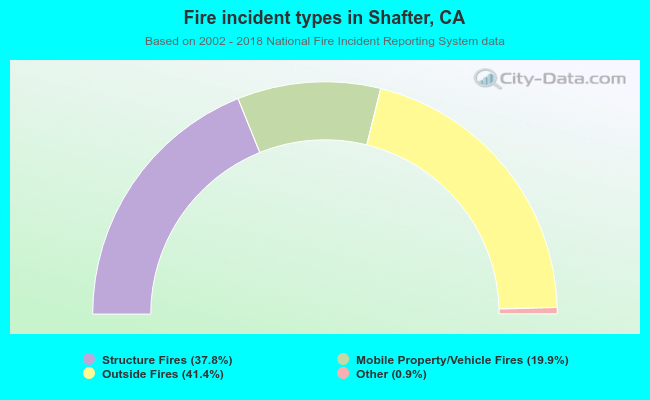 When looking into fire subcategories, the most incidents belonged to: Outside Fires (41.4%), and Structure Fires (37.8%).