McFarland: Fire Incidents, California (CA)
Where are fire incidents reported in McFarland, CA
Something went wrong! Please refresh the page.
|
| |||||||||||||||||||||||||||||||||||||||||||||||||||||||||||||||||||||||||||||||||||||||||||||||||||||||||||||
2002 - 2018 National Fire Incident Reporting System (NFIRS) incidents
- Incident types reported to NFIRS in McFarland, CA
- 1,96060.1%Rescue & EMS
- 47414.5%Fire
- 2918.9%Good Intent Call
- 2808.6%Hazardous Condition
- 1243.8%False Alarm
- 1233.8%Service Call
- 80.2%Special Incident
- Fire incident types reported to NFIRS in McFarland, CA
- 23449.4%Outside Fires
- 12626.6%Mobile Property/Vehicle Fires
- 11323.8%Structure Fires
- 10.2%Other
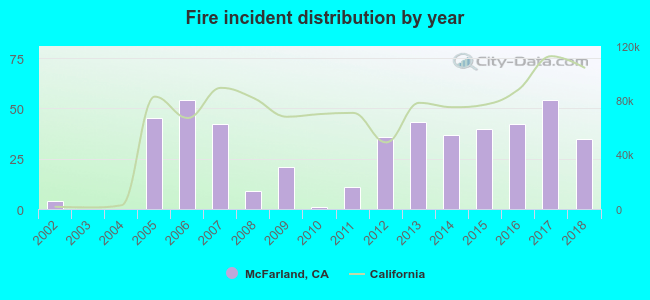 Based on the data from the years 2002 - 2018 the average number of fires per year is 28. The highest number of fires - 54 took place in 2006, and the least - 0 in 2003. The data has a rising trend.
The average number of yearly fire incidents per 10k residents in McFarland, CA compared to nearest cities:
(Note: Based on data for the last 3 years, including only cities with population 5,000 and above)
| McFarland: | 32.1 |
| Delano: | 26.3 |
| Wasco: | 30.0 |
| Shafter: | 34.7 |
| Earlimart: | 91.4 |
| Rosedale: | 1.1 |
| Oildale: | 38.1 |
| Greenacres: | 11.4 |
| Bakersfield: | 64.4 |
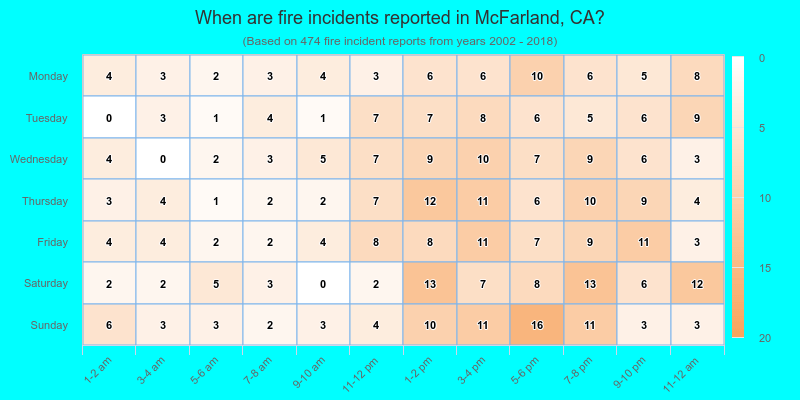
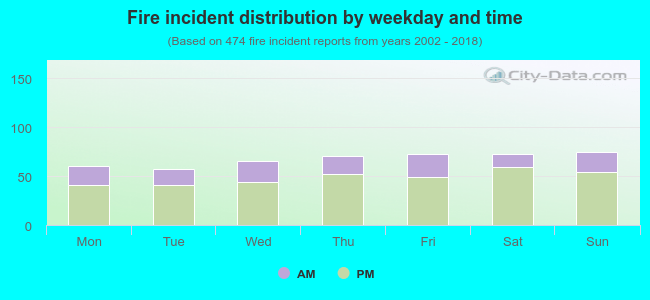 28.3% incidents where reported in the morning and 71.7% in the evening. The most fires (15.8%) took place on Sunday, and the least (12.0%) on Tuesday.
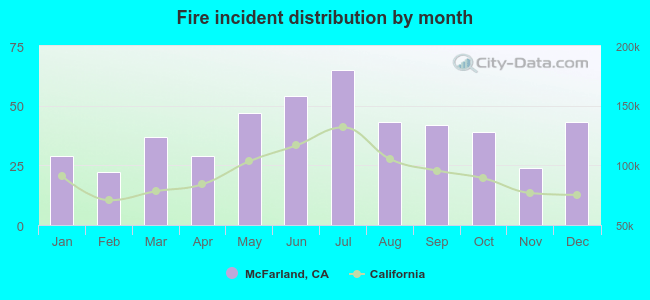 Based on the 474 fire incident reports from years 2002 - 2018 most fires (13.7%) took place during July, and the least (4.6%) in February.
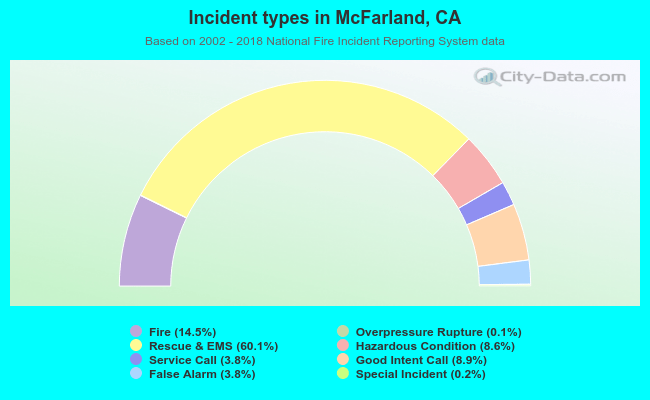 Out of all 3,262 cases reported during the years 2002 - 2018, the most belonged to the categories: Rescue & EMS (60.1%), Fire (14.5%), and Good Intent Call (8.9%).
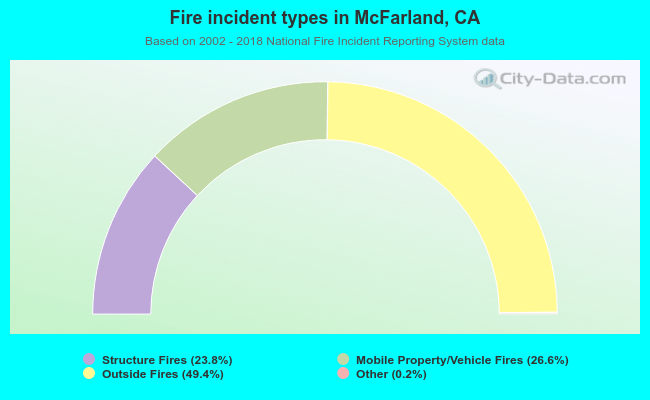 When looking into fire subcategories, the most incidents belonged to: Outside Fires (49.4%), and Mobile Property/Vehicle Fires (26.6%).