Delano: Fire Incidents, California (CA)
Where are fire incidents reported in Delano, CA
Something went wrong! Please refresh the page.
| Fire incidents reported | |
|---|---|
| Sreet name | Count |
| COUNTY LINE RD | 138 |
| HIGH ST | 136 |
| MAIN ST | 106 |
| GLENWOOD ST | 102 |
| GARCES HWY | 92 |
| LEXINGTON ST | 88 |
| JEFFERSON ST | 78 |
| ELLINGTON ST | 76 |
| CECIL AV | 74 |
| JASMINE ST | 70 |
| ALBANY ST | 64 |
| DOVER ST | 64 |
| CLINTON ST | 62 |
| FREMONT ST | 62 |
| CECIL | 58 |
| KENSINGTON ST | 54 |
| DOVER PL | 50 |
| INYO ST | 50 |
| BELMONT ST | 48 |
| GARCES HWY | 48 |
| AUSTIN ST | 44 |
| 20TH AV | 42 |
| 99 SOUTH HWY | 36 |
| COUNTY LINE RD | 36 |
| GIRARD ST | 36 |
| CECIL AV | 32 |
| QUINCY ST | 30 |
| CECIL AVE | 28 |
| 11TH AV | 26 |
| 99 NORTH HWY | 26 |
| Other | 144 |
2005 - 2018 National Fire Incident Reporting System (NFIRS) incidents
- Incident types reported to NFIRS in Delano, CA
- 4,78948.4%Rescue & EMS
- 2,00020.2%Fire
- 1,51215.3%Good Intent Call
- 7757.8%Hazardous Condition
- 4494.5%False Alarm
- 3443.5%Service Call
- 170.2%Special Incident
- Fire incident types reported to NFIRS in Delano, CA
- 84742.4%Outside Fires
- 65832.9%Structure Fires
- 48724.4%Mobile Property/Vehicle Fires
- 80.4%Other
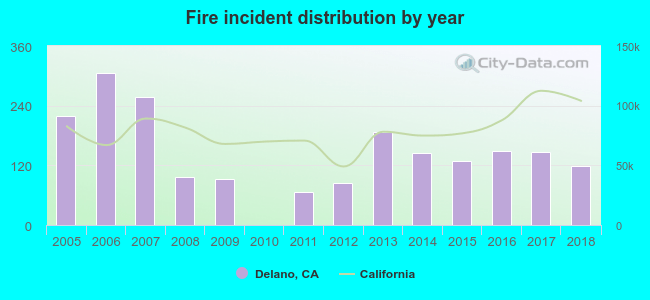 Based on the data from the years 2005 - 2018 the average number of fires per year is 143. The highest number of reported fire incidents - 306 took place in 2006, and the least - 0 in 2010. The data has a decreasing trend.
The average number of yearly fire incidents per 10k residents in Delano, CA compared to nearest cities:
(Note: Based on data for the last 3 years, including only cities with population 5,000 and above)
| Delano: | 26.3 |
| McFarland: | 32.1 |
| Earlimart: | 91.4 |
| Wasco: | 30.0 |
| Shafter: | 34.7 |
| Porterville: | 54.1 |
| Rosedale: | 1.1 |
| Oildale: | 38.1 |
| Greenacres: | 11.4 |
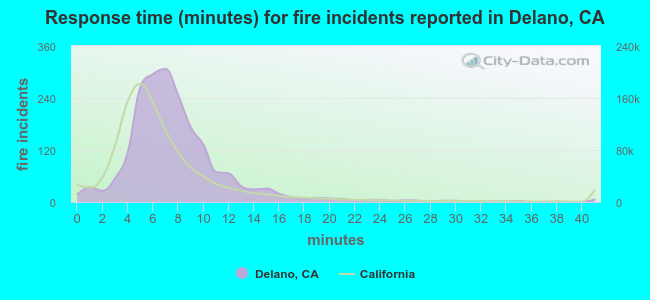 The median response time based on all reported fire incidents is 7 minutes. This is comparable to the California median value.
The median response time in Delano, CA compared to nearest cities:
(Note: Based on data for all years, including only cities with at least 500 fire incidents)
| Delano: | 7 minutes |
| Earlimart: | 8 minutes |
| Wasco: | 7 minutes |
| Shafter: | 7 minutes |
| Porterville: | 5 minutes |
| Oildale: | 6 minutes |
| Corcoran: | 6 minutes |
| Tulare: | 5 minutes |
| Bakersfield: | 7 minutes |
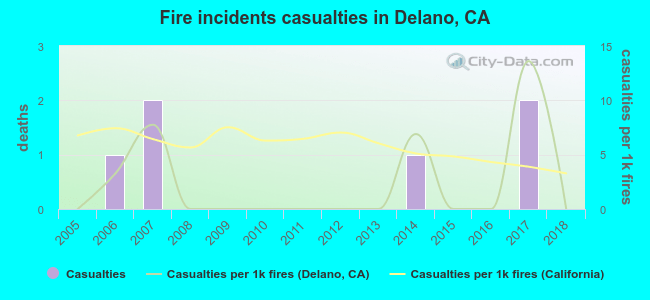 According to the data from the years 2005 - 2018 the average number of fire-related casualties per year is 0. The highest number of reported injuries - 2 took place in 2007, and the lowest - 0 in 2005. The data has a constant trend.
The average number of casualties per 1,000 fire incidents is 2. This indicator was the highest - 14 in 2017, and the lowest 0 in 2005. The trend for injuries per 1,000 fire incidents is constant. Compared to the California value the number of injuries per 1,000 incidents is lower.
According to the data from the years 2005 - 2018 the average number of fire-related casualties per year is 0. The highest number of reported injuries - 2 took place in 2007, and the lowest - 0 in 2005. The data has a constant trend.
The average number of casualties per 1,000 fire incidents is 2. This indicator was the highest - 14 in 2017, and the lowest 0 in 2005. The trend for injuries per 1,000 fire incidents is constant. Compared to the California value the number of injuries per 1,000 incidents is lower.Casualties per 1,000 incidents in Delano, CA compared to nearest cities:
(Note: Based on data for all years, including only cities with at least 500 fire incidents)
| Delano: | 3.0 |
| Earlimart: | 5.7 |
| Wasco: | 0.0 |
| Shafter: | 5.1 |
| Porterville: | 7.7 |
| Oildale: | 8.7 |
| Corcoran: | 12.1 |
| Tulare: | 11.2 |
| Bakersfield: | 3.0 |
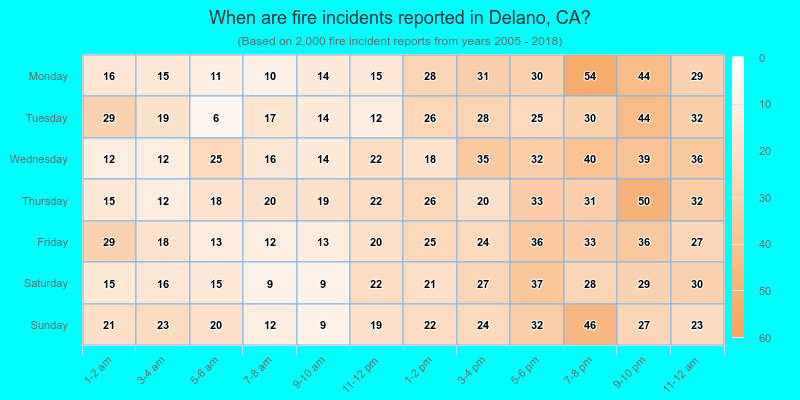
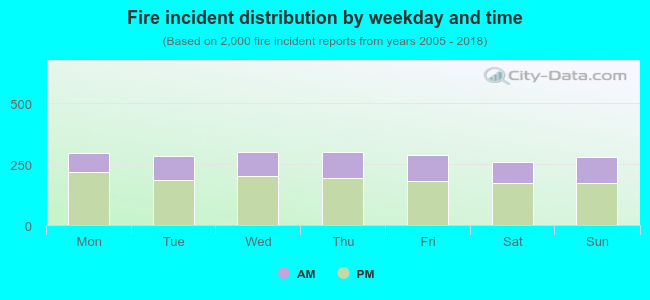 34.0% incidents where reported in the morning and 66.0% in the evening. The most fires (15.1%) took place on Wednesday, and the least (12.9%) on Saturday.
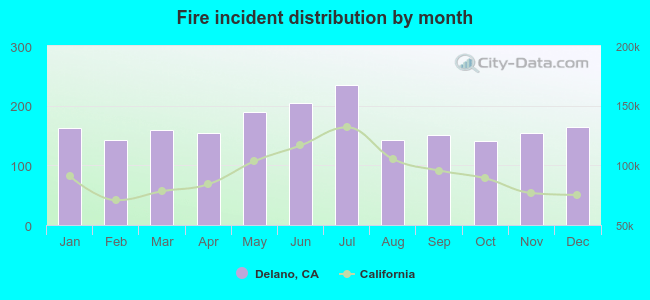 According to the 2,000 fires from years 2005 - 2018 most fires (11.7%) took place during July, and the least (7.0%) in October.
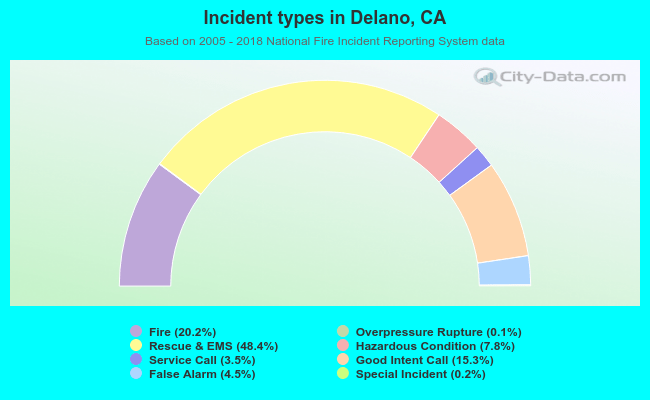 Out of all 9,894 cases reported during the years 2005 - 2018, the most belonged to the categories: Rescue & EMS (48.4%), Fire (20.2%), and Good Intent Call (15.3%).
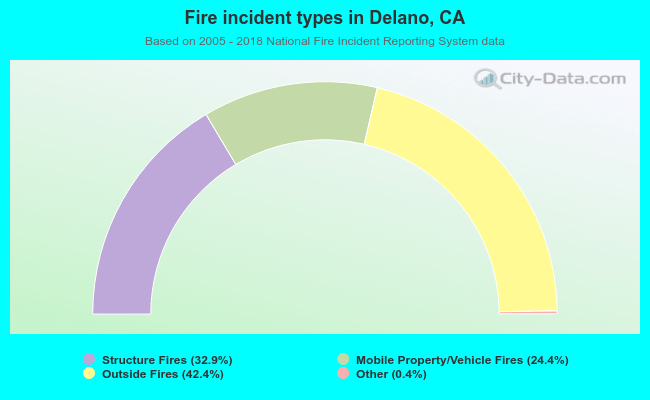 When looking into fire subcategories, the most incidents belonged to: Outside Fires (42.4%), and Structure Fires (32.9%).