Bakersfield: Fire Incidents, California (CA)
Where are fire incidents reported in Bakersfield, CA
Something went wrong! Please refresh the page.
| Fire incidents reported | |
|---|---|
| Sreet name | Count |
| CHESTER | 356 |
| UNION | 352 |
| BRUNDAGE LN | 334 |
| COLUMBUS ST | 268 |
| ROSEDALE HWY | 250 |
| NILES ST | 190 |
| COTTONWOOD RD | 186 |
| MING | 168 |
| CALIFORNIA | 160 |
| H ST | 160 |
| STOCKDALE HWY | 158 |
| WHITE LN | 156 |
| PANAMA LN | 154 |
| MT VERNON | 150 |
| FAIRFAX RD | 146 |
| LAKE ST | 138 |
| KENTUCKY ST | 128 |
| PACHECO RD | 124 |
| MONTEREY ST | 120 |
| 19TH ST | 110 |
| AUBURN ST | 108 |
| OWENS ST | 106 |
| BERNARD ST | 102 |
| PLANZ RD | 102 |
| 21ST ST | 100 |
| BELLE TERRACE | 100 |
| OREGON ST | 96 |
| GOLDEN STATE | 94 |
| CHESTER AVE | 92 |
| TRUXTUN | 92 |
| Other | 6,449 |
2005 - 2018 National Fire Incident Reporting System (NFIRS) incidents
- Incident types reported to NFIRS in Bakersfield, CA
- 77,57054.7%Rescue & EMS
- 33,06123.3%Good Intent Call
- 11,2497.9%Fire
- 7,8995.6%Service Call
- 5,5193.9%False Alarm
- 4,4573.1%Hazardous Condition
- 1,2760.9%Overpressure Rupture
- 7160.5%Special Incident
- Fire incident types reported to NFIRS in Bakersfield, CA
- 5,22246.4%Outside Fires
- 4,22337.5%Structure Fires
- 1,70615.2%Mobile Property/Vehicle Fires
- 980.9%Other
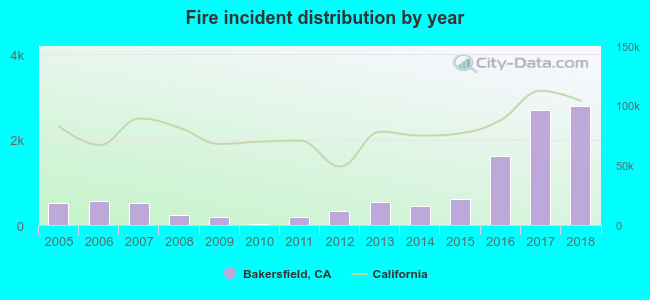 Based on the data from the years 2005 - 2018 the average number of fire incidents per year is 804. The highest number of reported fires - 2,797 took place in 2018, and the least - 31 in 2010. The data has a growing trend.
The average number of yearly fire incidents per 10k residents in Bakersfield, CA compared to nearest cities:
(Note: Based on data for the last 3 years, including only cities with population 5,000 and above)
| Bakersfield: | 64.4 |
| Oildale: | 38.1 |
| Greenacres: | 11.4 |
| Lamont: | 28.2 |
| Rosedale: | 1.1 |
| Arvin: | 37.7 |
| Shafter: | 34.7 |
| Wasco: | 30.0 |
| McFarland: | 32.1 |
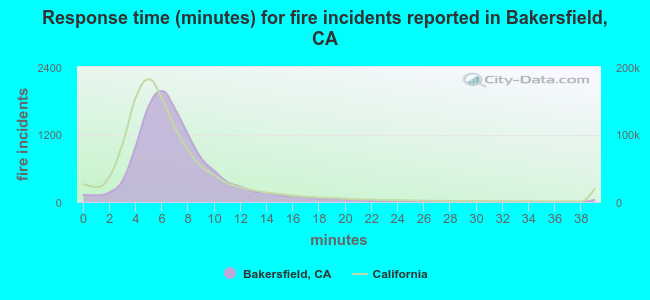 The median response time based on all reported fire incidents is 7 minutes. This is about the same as the California median value.
The median response time in Bakersfield, CA compared to nearest cities:
(Note: Based on data for all years, including only cities with at least 500 fire incidents)
| Bakersfield: | 7 minutes |
| Oildale: | 6 minutes |
| Lamont: | 7 minutes |
| Arvin: | 7 minutes |
| Shafter: | 7 minutes |
| Wasco: | 7 minutes |
| Taft: | 6 minutes |
| Delano: | 7 minutes |
| Tehachapi: | 7 minutes |
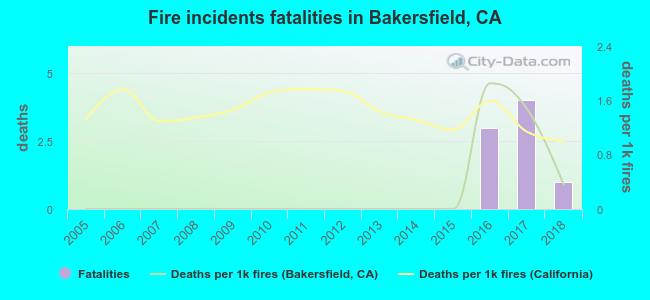 Based on the reports from the years 2005 - 2018 the average number of fire-related yearly deaths is 1. The highest number of deaths - 4 took place in 2017, and the lowest - 0 in 2005. The data has a growing trend.
The average number of fatalities per 1,000 fire incidents is 0. This indicator was the highest - 2 in 2016, and the lowest 0 in 2005. The trend for fatalities per 1,000 fires is increasing. Compared to the California value the number of fatalities per 1,000 fire incidents is lower.
Based on the reports from the years 2005 - 2018 the average number of fire-related yearly deaths is 1. The highest number of deaths - 4 took place in 2017, and the lowest - 0 in 2005. The data has a growing trend.
The average number of fatalities per 1,000 fire incidents is 0. This indicator was the highest - 2 in 2016, and the lowest 0 in 2005. The trend for fatalities per 1,000 fires is increasing. Compared to the California value the number of fatalities per 1,000 fire incidents is lower.Deaths per 1,000 incidents in Bakersfield, CA compared to nearest cities:
(Note: Based on data for all years, including only cities with at least 2,500 fire incidents)
| Bakersfield: | 0.7 |
| Porterville: | 1.9 |
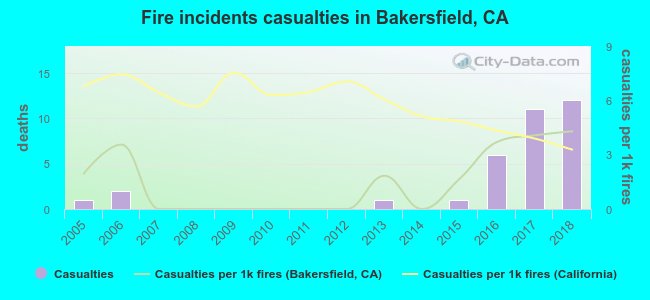 Based on the data from the years 2005 - 2018 the average number of fire-related casualties per year is 2. The highest number of injuries - 12 took place in 2018, and the lowest - 0 in 2007. The data has an increasing trend.
The average number of casualties per 1,000 fires is 2. This indicator was the highest - 4 in 2018, and the lowest 0 in 2007. The trend for injuries per 1,000 incidents is increasing. Compared to the state value the number of casualties per 1,000 incidents is lower.
Based on the data from the years 2005 - 2018 the average number of fire-related casualties per year is 2. The highest number of injuries - 12 took place in 2018, and the lowest - 0 in 2007. The data has an increasing trend.
The average number of casualties per 1,000 fires is 2. This indicator was the highest - 4 in 2018, and the lowest 0 in 2007. The trend for injuries per 1,000 incidents is increasing. Compared to the state value the number of casualties per 1,000 incidents is lower.
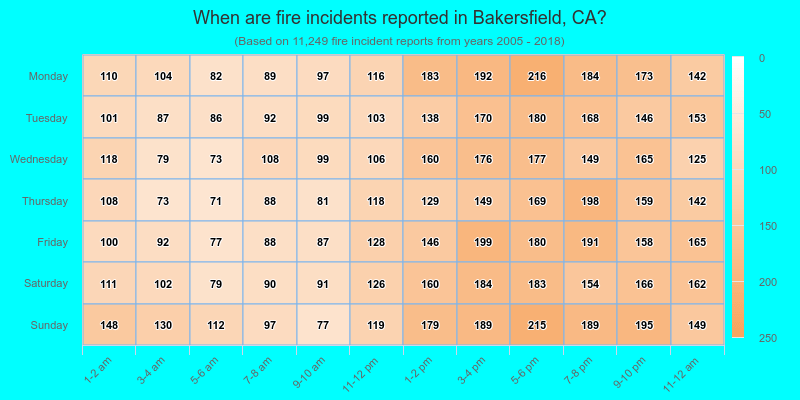
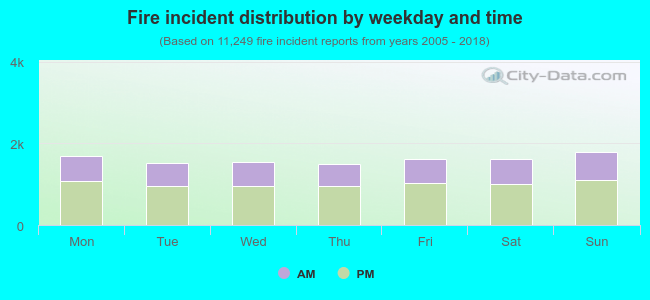 36.8% incidents where reported in the morning and 63.2% in the evening. The most fires (16.0%) took place on Sunday, and the least (13.2%) on Thursday.
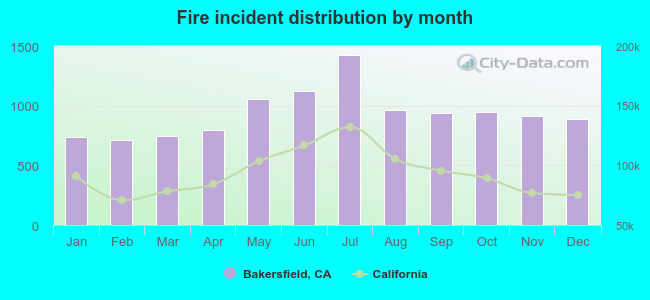 Based on the 11,249 fire incidents from years 2005 - 2018 most fires (12.7%) took place during July, and the least (6.3%) in February.
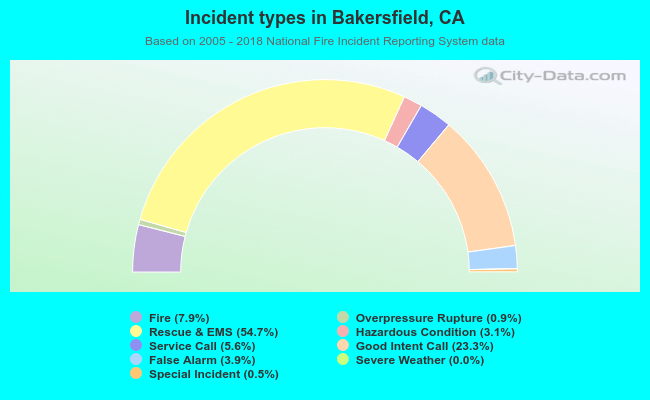 Out of all 141,758 cases reported during the years 2005 - 2018, the most belonged to the categories: Rescue & EMS (54.7%), Good Intent Call (23.3%), and Fire (7.9%).
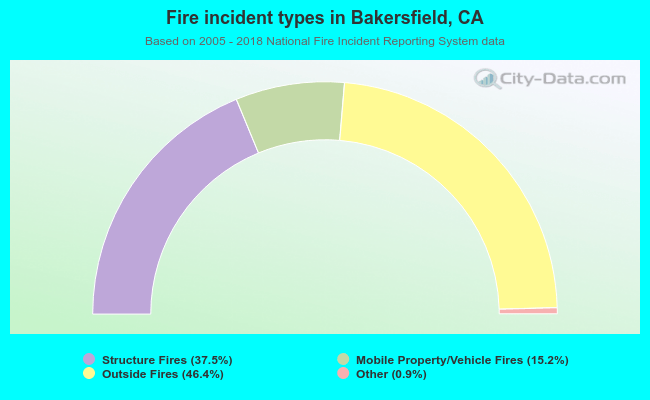 When looking into fire subcategories, the most reports belonged to: Outside Fires (46.4%), and Structure Fires (37.5%).