Oildale: Fire Incidents, California (CA)
Where are fire incidents reported in Oildale, CA
Something went wrong! Please refresh the page.
| Fire incidents reported | |
|---|---|
| Sreet name | Count |
| ROBERTS LN | 186 |
| AIRPORT DR | 124 |
| DECATUR ST | 102 |
| CHESTER AV | 100 |
| WILLOW DR | 94 |
| WILSON AV | 84 |
| BEARDSLEY AV | 76 |
| WOODROW AV | 70 |
| CHESTER | 66 |
| MC CORD AV | 66 |
| STATE RD | 66 |
| WASHINGTON AV | 66 |
| OILDALE DR | 64 |
| OLIVE DR | 64 |
| LINCOLN AV | 62 |
| N CHESTER AV | 62 |
| EL TEJON AV | 54 |
| WOODROW | 52 |
| ANN ARBOR DR | 44 |
| LINDA VISTA DR | 40 |
| SEQUOIA DR | 40 |
| BEARDSLEY | 36 |
| WASHINGTON | 34 |
| WILSON | 34 |
| CASTAIC | 32 |
| LINCOLN | 32 |
| WARREN AV | 32 |
| ARVIN ST | 30 |
| CHINA GRADE LOOP | 30 |
| MINNER AV | 30 |
2005 - 2018 National Fire Incident Reporting System (NFIRS) incidents
- Incident types reported to NFIRS in Oildale, CA
- 7,26248.6%Rescue & EMS
- 3,22321.6%Good Intent Call
- 1,84212.3%Fire
- 1,2898.6%Hazardous Condition
- 8395.6%Service Call
- 2901.9%False Alarm
- 1501.0%Special Incident
- 390.3%Overpressure Rupture
- Fire incident types reported to NFIRS in Oildale, CA
- 87347.4%Outside Fires
- 74840.6%Structure Fires
- 20211.0%Mobile Property/Vehicle Fires
- 191.0%Other
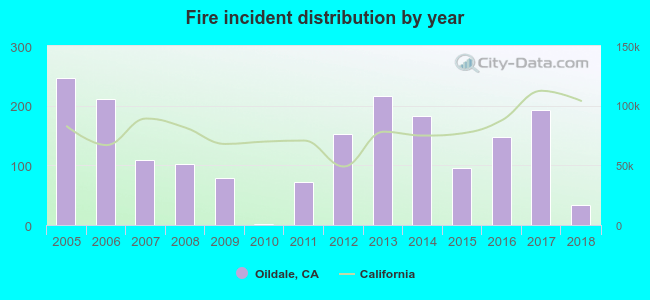 According to the data from the years 2005 - 2018 the average number of fire incidents per year is 132. The highest number of reported fires - 247 took place in 2005, and the least - 2 in 2010. The data has a dropping trend.
The average number of yearly fire incidents per 10k residents in Oildale, CA compared to nearest cities:
(Note: Based on data for the last 3 years, including only cities with population 5,000 and above)
| Oildale: | 38.1 |
| Bakersfield: | 64.4 |
| Greenacres: | 11.4 |
| Rosedale: | 1.1 |
| Lamont: | 28.2 |
| Shafter: | 34.7 |
| Arvin: | 37.7 |
| McFarland: | 32.1 |
| Wasco: | 30.0 |
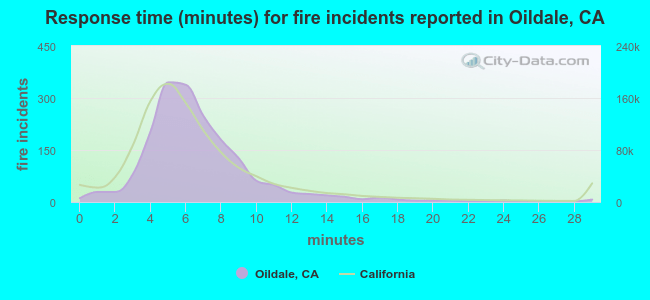 The median response time based on all reported fire incidents is 6 minutes. This is comparable to the California median value.
The median response time in Oildale, CA compared to nearest cities:
(Note: Based on data for all years, including only cities with at least 500 fire incidents)
| Oildale: | 6 minutes |
| Bakersfield: | 7 minutes |
| Lamont: | 7 minutes |
| Shafter: | 7 minutes |
| Arvin: | 7 minutes |
| Wasco: | 7 minutes |
| Delano: | 7 minutes |
| Taft: | 6 minutes |
| Earlimart: | 8 minutes |
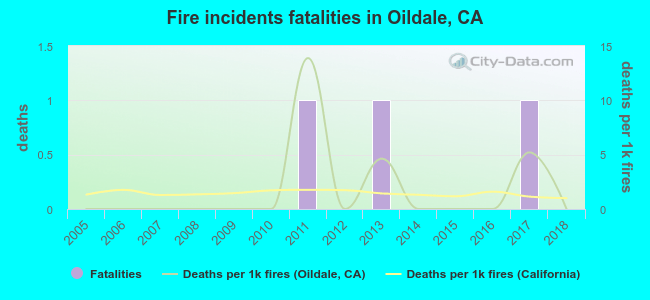 According to the reports from the years 2005 - 2018 the average number of fire-related fatalities per year is 0. The highest number of reported deaths - 1 took place in 2011, and the lowest - 0 in 2005. The data has a constant trend.
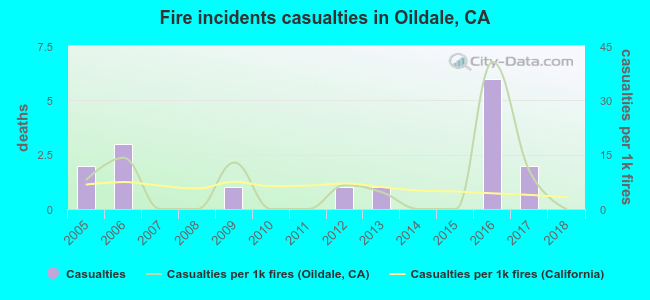 According to the data from the years 2005 - 2018 the average number of fire-related casualties per year is 1. The highest number of reported casualties - 6 took place in 2016, and the lowest - 0 in 2007. The data has a dropping trend.
The average number of injuries per 1,000 fire incidents is 7. This indicator was the highest - 41 in 2016, and the lowest 0 in 2007. The trend for injuries per 1,000 fire incidents is declining. Compared to the state value the number of casualties per 1,000 fires is higher.
According to the data from the years 2005 - 2018 the average number of fire-related casualties per year is 1. The highest number of reported casualties - 6 took place in 2016, and the lowest - 0 in 2007. The data has a dropping trend.
The average number of injuries per 1,000 fire incidents is 7. This indicator was the highest - 41 in 2016, and the lowest 0 in 2007. The trend for injuries per 1,000 fire incidents is declining. Compared to the state value the number of casualties per 1,000 fires is higher.
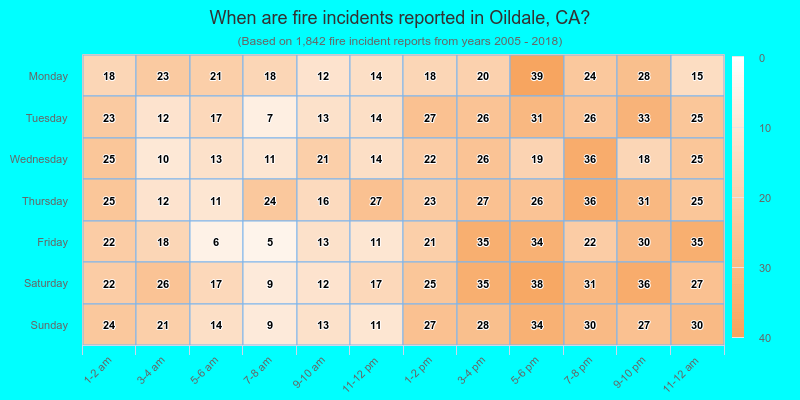
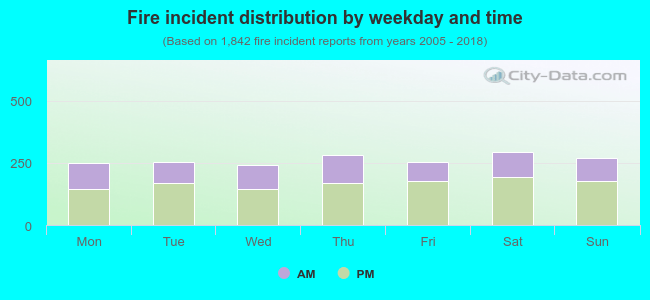 36.4% incidents where reported in the morning and 63.6% in the evening. The most fires (16.0%) took place on Saturday, and the least (13.0%) on Wednesday.
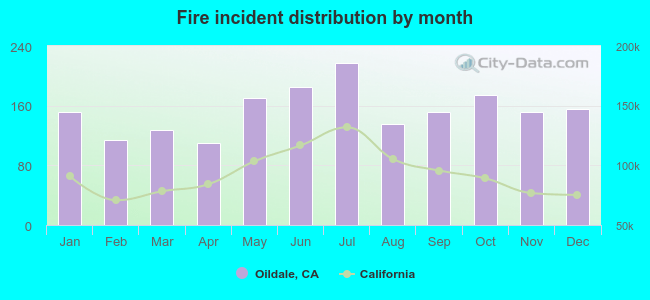 Based on the 1,842 fire incidents from years 2005 - 2018 most fires (11.8%) took place during July, and the least (6.0%) in April.
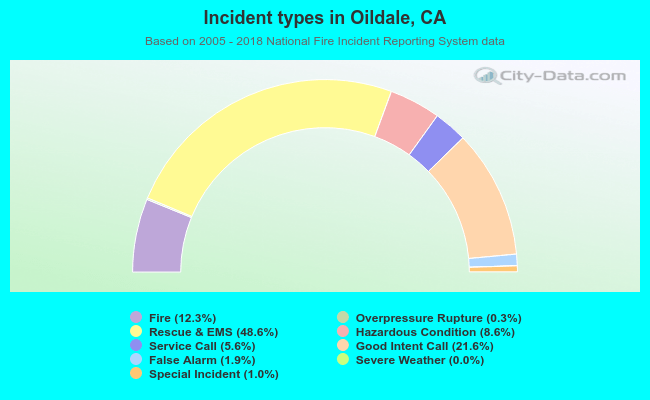 Out of all 14,935 cases reported during the years 2005 - 2018, the most belonged to the categories: Rescue & EMS (48.6%), Good Intent Call (21.6%), and Fire (12.3%).
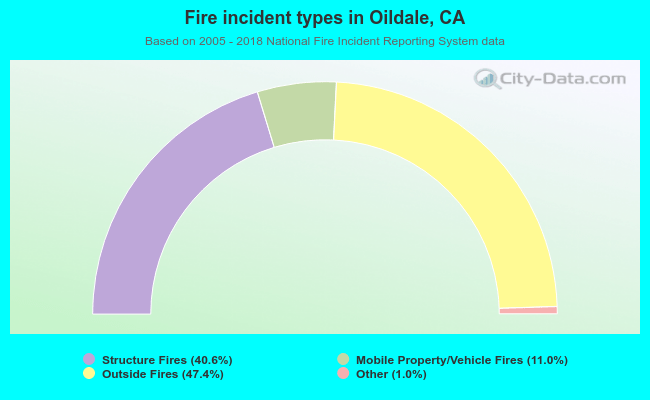 When looking into fire subcategories, the most reports belonged to: Outside Fires (47.4%), and Structure Fires (40.6%).