Santa Ana: Fire Incidents, California (CA)
Where are fire incidents reported in Santa Ana, CA
Something went wrong! Please refresh the page.
| Fire incidents reported | |
|---|---|
| Sreet name | Count |
| 1ST | 270 |
| MAIN | 216 |
| EDINGER | 168 |
| BRISTOL | 158 |
| FAIRVIEW | 126 |
| 17TH | 116 |
| 5TH | 108 |
| BRISTOL ST | 102 |
| HARBOR | 98 |
| 4TH | 90 |
| MAIN ST | 86 |
| 1ST ST | 82 |
| GRAND | 82 |
| WARNER | 76 |
| MCFADDEN | 74 |
| FLOWER | 68 |
| GRAND AV | 62 |
| SANTA ANA | 60 |
| 17TH ST | 58 |
| MACARTHUR | 58 |
| TUSTIN | 56 |
| FAIRVIEW ST | 54 |
| STANDARD | 54 |
| CITY OF SANTA ANA | 52 |
| BROADWAY | 48 |
| DYER | 48 |
| EDINGER AV | 48 |
| FLOWER ST | 46 |
| CHESTNUT | 44 |
| LYON | 44 |
| Other | 1,212 |
2005 - 2018 National Fire Incident Reporting System (NFIRS) incidents
- Incident types reported to NFIRS in Santa Ana, CA
- 76,33276.8%Rescue & EMS
- 10,48510.6%Good Intent Call
- 3,8643.9%Fire
- 3,5053.5%False Alarm
- 2,9783.0%Service Call
- 2,0192.0%Hazardous Condition
- Fire incident types reported to NFIRS in Santa Ana, CA
- 1,52539.5%Outside Fires
- 1,20231.1%Structure Fires
- 90623.4%Mobile Property/Vehicle Fires
- 2316.0%Other
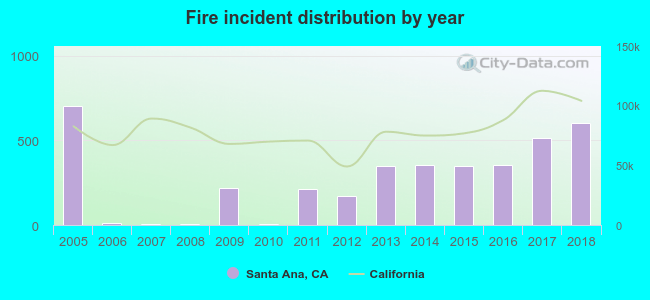 According to the data from the years 2005 - 2018 the average number of fire incidents per year is 276. The highest number of reported fires - 705 took place in 2005, and the least - 4 in 2007. The data has a dropping trend.
The average number of yearly fire incidents per 10k residents in Santa Ana, CA compared to nearest cities:
(Note: Based on data for the last 3 years, including only cities with population 5,000 and above)
| Santa Ana: | 14.7 |
| Tustin: | 12.4 |
| Fountain Valley: | 2.5 |
| Orange: | 5.0 |
| Garden Grove: | 3.6 |
| North Tustin: | 0.8 |
| Costa Mesa: | 17.6 |
| Midway City: | 10.2 |
| Irvine: | 11.3 |
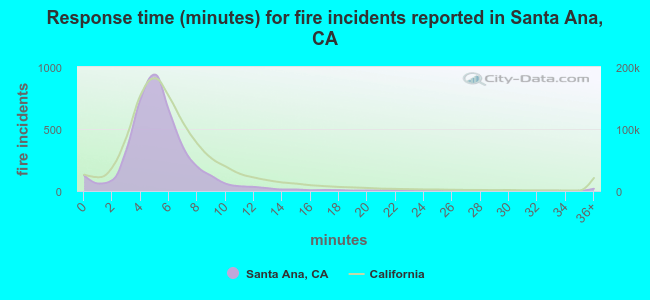 The median response time based on all reported fire incidents is 5 minutes. This is lower than the California median value.
The median response time in Santa Ana, CA compared to nearest cities:
(Note: Based on data for all years, including only cities with at least 500 fire incidents)
| Santa Ana: | 5 minutes |
| Tustin: | 6 minutes |
| Fountain Valley: | 6 minutes |
| Orange: | 5 minutes |
| Garden Grove: | 6 minutes |
| Costa Mesa: | 5 minutes |
| Irvine: | 6 minutes |
| Westminster: | 5 minutes |
| Anaheim: | 6 minutes |
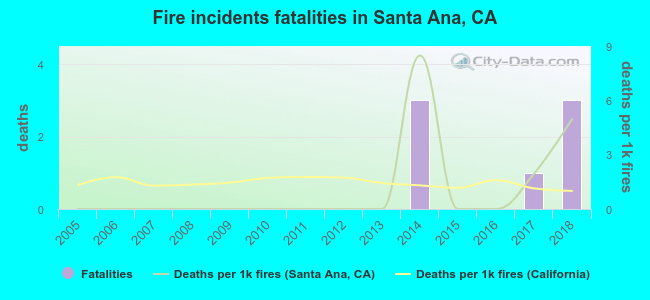 According to the reports from the years 2005 - 2018 the average number of fire-related yearly deaths is 1. The highest number of reported deaths - 3 took place in 2014, and the lowest - 0 in 2005. The data has an increasing trend.
The average number of fatalities per 1,000 fires is 1. This indicator was the highest - 8 in 2014, and the lowest 0 in 2005. The trend for deaths per 1,000 incidents is increasing. Compared to the California value the number of fatalities per 1,000 fires is higher.
According to the reports from the years 2005 - 2018 the average number of fire-related yearly deaths is 1. The highest number of reported deaths - 3 took place in 2014, and the lowest - 0 in 2005. The data has an increasing trend.
The average number of fatalities per 1,000 fires is 1. This indicator was the highest - 8 in 2014, and the lowest 0 in 2005. The trend for deaths per 1,000 incidents is increasing. Compared to the California value the number of fatalities per 1,000 fires is higher.Deaths per 1,000 incidents in Santa Ana, CA compared to nearest cities:
(Note: Based on data for all years, including only cities with at least 2,500 fire incidents)
| Santa Ana: | 1.8 |
| Costa Mesa: | 1.1 |
| Irvine: | 1.2 |
| Anaheim: | 0.9 |
| Long Beach: | 1.1 |
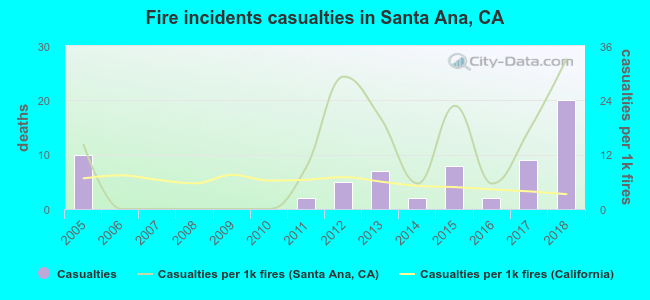 Based on the data from the years 2005 - 2018 the average number of fire-related yearly casualties is 5. The highest number of injuries - 20 took place in 2018, and the lowest - 0 in 2006. The data has a growing trend.
The average number of injuries per 1,000 fires is 11. This indicator was the highest - 33 in 2018, and the lowest 0 in 2006. The trend for casualties per 1,000 incidents is rising. Compared to the state value the number of casualties per 1,000 incidents is much higher.
Based on the data from the years 2005 - 2018 the average number of fire-related yearly casualties is 5. The highest number of injuries - 20 took place in 2018, and the lowest - 0 in 2006. The data has a growing trend.
The average number of injuries per 1,000 fires is 11. This indicator was the highest - 33 in 2018, and the lowest 0 in 2006. The trend for casualties per 1,000 incidents is rising. Compared to the state value the number of casualties per 1,000 incidents is much higher.Casualties per 1,000 incidents in Santa Ana, CA compared to nearest cities:
(Note: Based on data for all years, including only cities with at least 500 fire incidents)
| Santa Ana: | 16.8 |
| Tustin: | 20.1 |
| Fountain Valley: | 31.9 |
| Orange: | 4.6 |
| Garden Grove: | 24.0 |
| Costa Mesa: | 16.4 |
| Irvine: | 15.1 |
| Westminster: | 24.0 |
| Anaheim: | 4.3 |
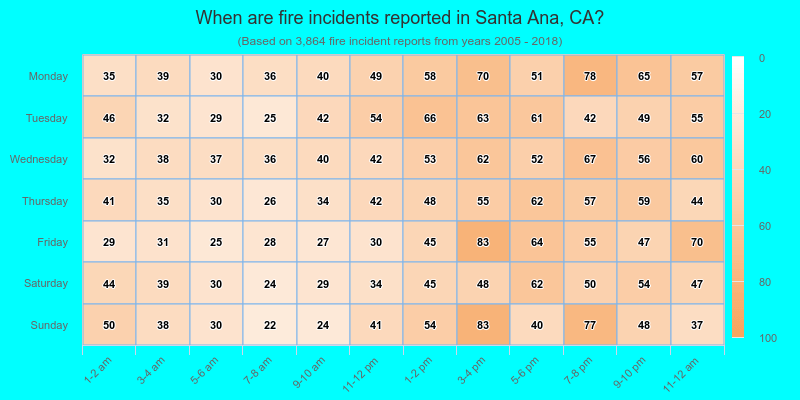
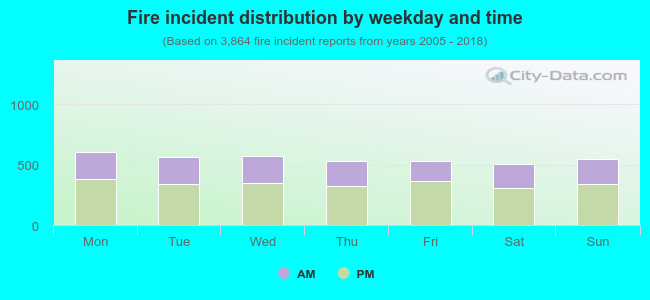 37.9% incidents where reported in the morning and 62.1% in the evening. The most fires (15.7%) took place on Monday, and the least (13.1%) on Saturday.
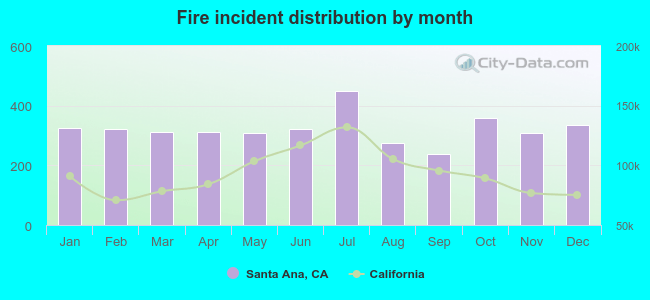 According to the 3,864 reports from years 2005 - 2018 most fires (11.6%) took place during July, and the least (6.2%) in September.
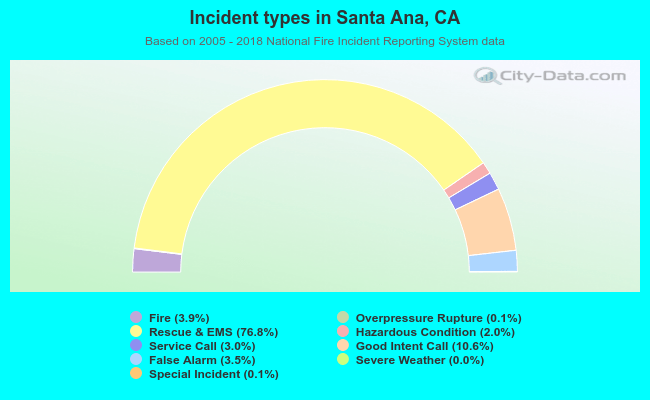 Out of all 99,347 cases reported during the years 2005 - 2018, the most belonged to the categories: Rescue & EMS (76.8%), Good Intent Call (10.6%), and Fire (3.9%).
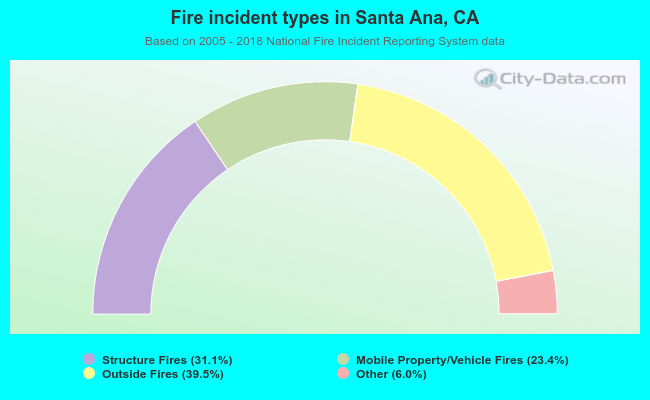 When looking into fire subcategories, the most incidents belonged to: Outside Fires (39.5%), and Structure Fires (31.1%).