Irvine: Fire Incidents, California (CA)
Where are fire incidents reported in Irvine, CA
Something went wrong! Please refresh the page.
| Fire incidents reported | |
|---|---|
| Sreet name | Count |
| BARRANCA | 122 |
| ALTON | 118 |
| CULVER | 92 |
| JEFFREY | 78 |
| PALATINE | 78 |
| MICHELSON | 72 |
| JAMBOREE | 70 |
| IRVINE | 66 |
| MAIN | 62 |
| STANFORD | 56 |
| IRVINE CENTER | 54 |
| PARKVIEW | 54 |
| VON KARMAN | 54 |
| WALNUT | 54 |
| CAMPUS | 46 |
| YALE | 42 |
| SPECTRUM | 40 |
| TECHNOLOGY | 38 |
| CONSTRUCTION | 34 |
| HAYES | 34 |
| SAND CANYON | 34 |
| SKY PARK | 34 |
| MEADOWBROOK | 32 |
| FORTUNE | 30 |
| RESEARCH | 28 |
| SPECTRUM CENTER | 28 |
| HARVARD | 26 |
| KELVIN | 26 |
| PORTOLA | 26 |
| VENETO | 26 |
| Other | 1,824 |
2005 - 2018 National Fire Incident Reporting System (NFIRS) incidents
- Incident types reported to NFIRS in Irvine, CA
- 41,80466.9%Rescue & EMS
- 6,58710.5%Good Intent Call
- 5,7359.2%False Alarm
- 3,3785.4%Fire
- 2,9084.7%Service Call
- 1,9133.1%Hazardous Condition
- 1060.2%Overpressure Rupture
- Fire incident types reported to NFIRS in Irvine, CA
- 1,22136.1%Outside Fires
- 97528.9%Structure Fires
- 91927.2%Mobile Property/Vehicle Fires
- 2637.8%Other
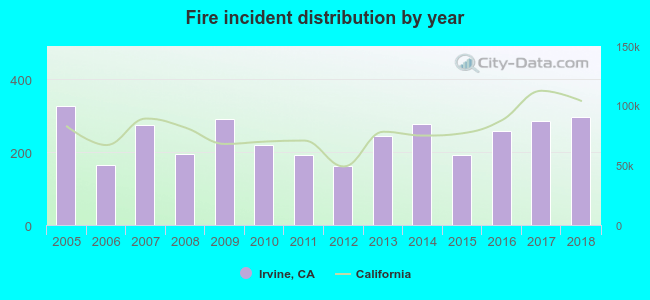 According to the data from the years 2005 - 2018 the average number of fire incidents per year is 241. The highest number of reported fire incidents - 327 took place in 2005, and the least - 163 in 2012. The data has a declining trend.
The average number of yearly fire incidents per 10k residents in Irvine, CA compared to nearest cities:
(Note: Based on data for the last 3 years, including only cities with population 5,000 and above)
| Irvine: | 11.3 |
| Tustin: | 12.4 |
| North Tustin: | 0.8 |
| Laguna Woods: | 12.8 |
| Santa Ana: | 14.7 |
| Lake Forest: | 1.0 |
| Costa Mesa: | 17.6 |
| Newport Beach: | 14.5 |
| Laguna Hills: | 15.7 |
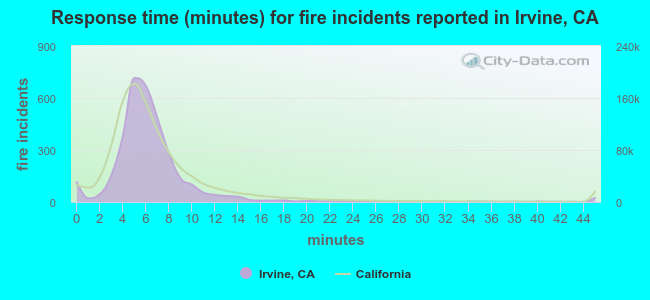 The median response time based on all reported fire incidents is 6 minutes. This is comparable to the state median value.
The median response time in Irvine, CA compared to nearest cities:
(Note: Based on data for all years, including only cities with at least 500 fire incidents)
| Irvine: | 6 minutes |
| Tustin: | 6 minutes |
| Santa Ana: | 5 minutes |
| Costa Mesa: | 5 minutes |
| Newport Beach: | 6 minutes |
| Laguna Hills: | 6 minutes |
| Orange: | 5 minutes |
| Mission Viejo: | 6 minutes |
| Fountain Valley: | 6 minutes |
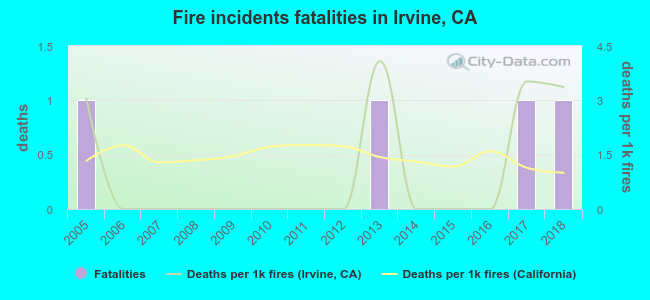 According to the data from the years 2005 - 2018 the average number of fire-related fatalities per year is 0. The highest number of deaths - 1 took place in 2005, and the lowest - 0 in 2006. The data has a constant trend.
The average number of fatalities per 1,000 fires is 1. This indicator was the highest - 4 in 2013, and the lowest 0 in 2006. The trend for deaths per 1,000 fire incidents is growing. Compared to the state value the number of deaths per 1,000 fire incidents is about the same.
According to the data from the years 2005 - 2018 the average number of fire-related fatalities per year is 0. The highest number of deaths - 1 took place in 2005, and the lowest - 0 in 2006. The data has a constant trend.
The average number of fatalities per 1,000 fires is 1. This indicator was the highest - 4 in 2013, and the lowest 0 in 2006. The trend for deaths per 1,000 fire incidents is growing. Compared to the state value the number of deaths per 1,000 fire incidents is about the same.Deaths per 1,000 incidents in Irvine, CA compared to nearest cities:
(Note: Based on data for all years, including only cities with at least 2,500 fire incidents)
| Irvine: | 1.2 |
| Santa Ana: | 1.8 |
| Costa Mesa: | 1.1 |
| Anaheim: | 0.9 |
| Long Beach: | 1.1 |
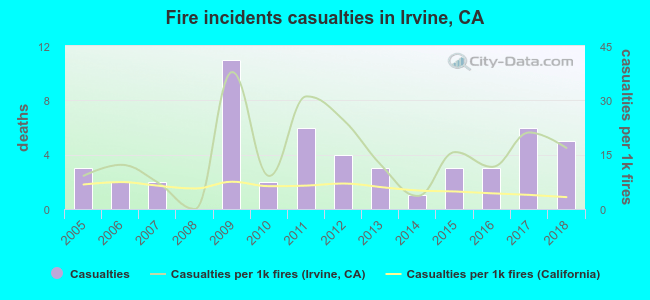 Based on the reports from the years 2005 - 2018 the average number of fire-related casualties per year is 4. The highest number of casualties - 11 took place in 2009, and the lowest - 0 in 2008. The data has a growing trend.
The average number of injuries per 1,000 fires is 15. This indicator was the highest - 38 in 2009, and the lowest 0 in 2008. The trend for injuries per 1,000 fires is rising. Compared to the state value the number of casualties per 1,000 incidents is much higher.
Based on the reports from the years 2005 - 2018 the average number of fire-related casualties per year is 4. The highest number of casualties - 11 took place in 2009, and the lowest - 0 in 2008. The data has a growing trend.
The average number of injuries per 1,000 fires is 15. This indicator was the highest - 38 in 2009, and the lowest 0 in 2008. The trend for injuries per 1,000 fires is rising. Compared to the state value the number of casualties per 1,000 incidents is much higher.Casualties per 1,000 incidents in Irvine, CA compared to nearest cities:
(Note: Based on data for all years, including only cities with at least 500 fire incidents)
| Irvine: | 15.1 |
| Tustin: | 20.1 |
| Santa Ana: | 16.8 |
| Costa Mesa: | 16.4 |
| Newport Beach: | 3.6 |
| Laguna Hills: | 8.0 |
| Orange: | 4.6 |
| Mission Viejo: | 16.8 |
| Fountain Valley: | 31.9 |
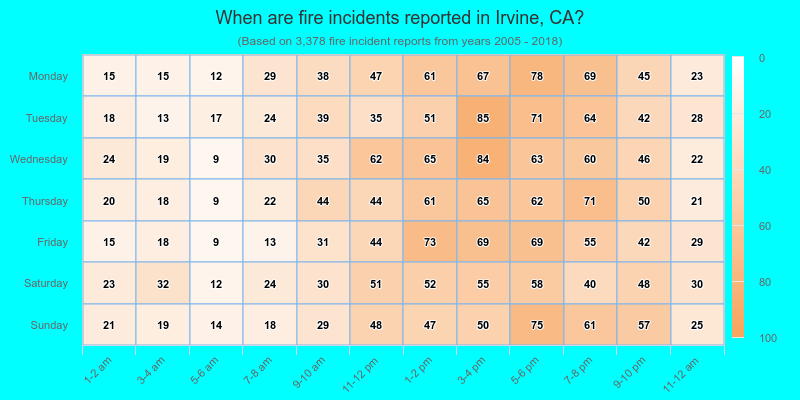
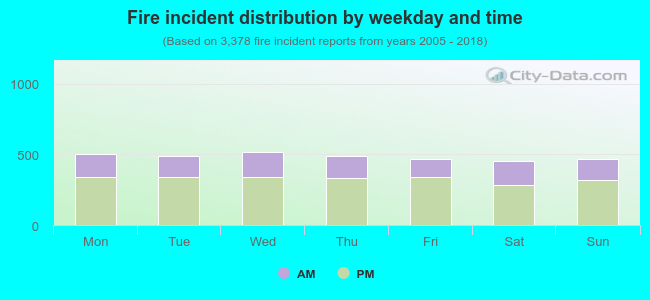 32.2% incidents where reported in the morning and 67.8% in the evening. The most fires (15.4%) took place on Wednesday, and the least (13.5%) on Saturday.
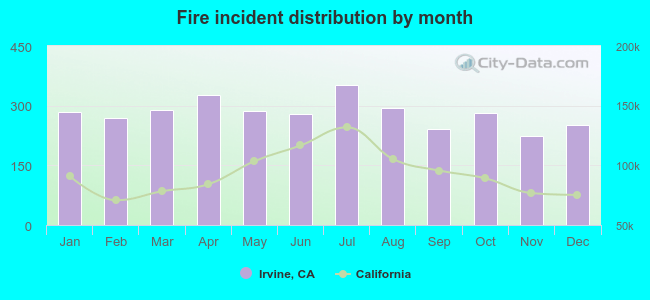 According to the 3,378 fires from years 2005 - 2018 most fires (10.4%) took place during July, and the least (6.6%) in November.
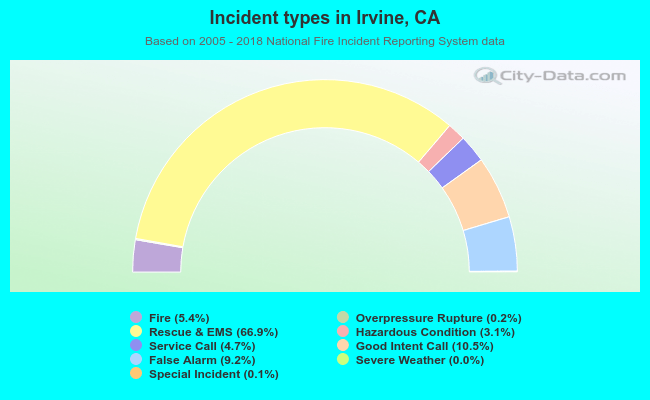 Out of all 62,490 cases reported during the years 2005 - 2018, the most belonged to the categories: Rescue & EMS (66.9%), Good Intent Call (10.5%), and False Alarm (9.2%).
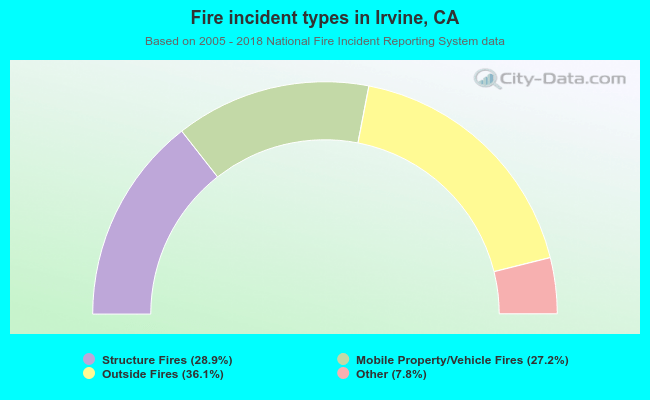 When looking into fire subcategories, the most incidents belonged to: Outside Fires (36.1%), and Structure Fires (28.9%).