Anaheim: Fire Incidents, California (CA)
Where are fire incidents reported in Anaheim, CA
Something went wrong! Please refresh the page.
| Fire incidents reported | |
|---|---|
| Sreet name | Count |
| LINCOLN AVE | 322 |
| LA PALMA AVE | 222 |
| BALL | 180 |
| EB 91 FY | 122 |
| HARBOR BLVD | 110 |
| ANAHEIM BLVD | 100 |
| KATELLA AVE | 100 |
| STATE COLLEGE BLVD | 98 |
| BALL RD | 88 |
| BROADWAY | 78 |
| LINCOLN | 78 |
| BEACH BLVD | 74 |
| WB 91 FY | 74 |
| EUCLID | 72 |
| BROOKHURST | 70 |
| ORANGE AVE | 68 |
| MAGNOLIA AVE | 62 |
| LA PALMA | 60 |
| ORANGEWOOD AVE | 56 |
| CERRITOS AVE | 50 |
| EUCLID ST | 50 |
| BROOKHURST ST | 46 |
| EAST | 44 |
| MIRALOMA | 40 |
| CRESCENT AVE | 36 |
| SAVANNA | 36 |
| ORANGE | 34 |
| SB 5 FY | 34 |
| WAKEFIELD AVE | 34 |
| ORANGETHORPE AVE | 32 |
| Other | 2,147 |
2005 - 2018 National Fire Incident Reporting System (NFIRS) incidents
- Incident types reported to NFIRS in Anaheim, CA
- 61,87164.1%Rescue & EMS
- 20,61921.4%Good Intent Call
- 5,3185.5%Service Call
- 4,6174.8%Fire
- 2,1362.2%Hazardous Condition
- 1,8741.9%False Alarm
- Fire incident types reported to NFIRS in Anaheim, CA
- 1,60834.8%Structure Fires
- 1,53433.2%Outside Fires
- 1,09723.8%Mobile Property/Vehicle Fires
- 3788.2%Other
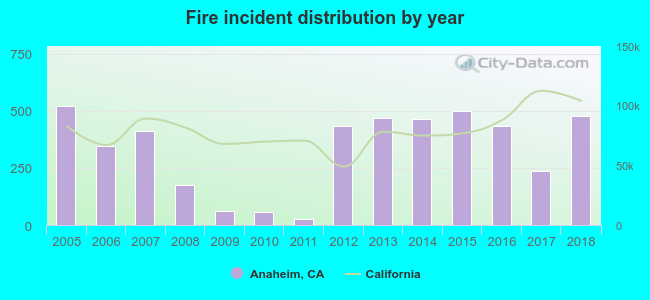 According to the data from the years 2005 - 2018 the average number of fire incidents per year is 330. The highest number of reported fires - 523 took place in 2005, and the least - 28 in 2011. The data has a dropping trend.
The average number of yearly fire incidents per 10k residents in Anaheim, CA compared to nearest cities:
(Note: Based on data for the last 3 years, including only cities with population 5,000 and above)
| Anaheim: | 11.0 |
| Placentia: | 8.7 |
| Fullerton: | 9.2 |
| Orange: | 5.0 |
| Villa Park: | 6.7 |
| Garden Grove: | 3.6 |
| Brea: | 14.2 |
| Stanton: | 12.4 |
| Santa Ana: | 14.7 |
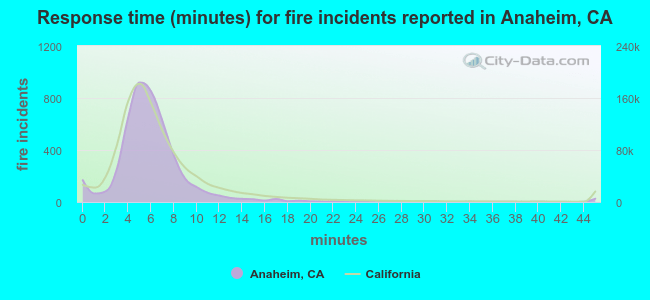 The median response time based on all reported fire incidents is 6 minutes. This is similar to the state median value.
The median response time in Anaheim, CA compared to nearest cities:
(Note: Based on data for all years, including only cities with at least 500 fire incidents)
| Anaheim: | 6 minutes |
| Placentia: | 5 minutes |
| Fullerton: | 6 minutes |
| Orange: | 5 minutes |
| Garden Grove: | 6 minutes |
| Stanton: | 5 minutes |
| Santa Ana: | 5 minutes |
| Buena Park: | 5 minutes |
| Yorba Linda: | 7 minutes |
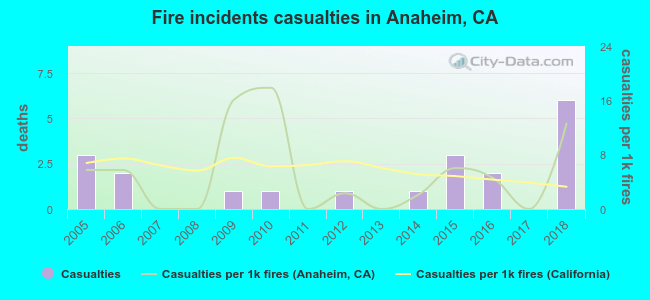 According to the data from the years 2005 - 2018 the average number of fire-related yearly casualties is 1. The highest number of injuries - 6 took place in 2018, and the lowest - 0 in 2007. The data has a growing trend.
The average number of injuries per 1,000 fires is 5. This indicator was the highest - 18 in 2010, and the lowest 0 in 2007. The trend for casualties per 1,000 incidents is increasing. Compared to the state value the number of injuries per 1,000 fire incidents is lower.
According to the data from the years 2005 - 2018 the average number of fire-related yearly casualties is 1. The highest number of injuries - 6 took place in 2018, and the lowest - 0 in 2007. The data has a growing trend.
The average number of injuries per 1,000 fires is 5. This indicator was the highest - 18 in 2010, and the lowest 0 in 2007. The trend for casualties per 1,000 incidents is increasing. Compared to the state value the number of injuries per 1,000 fire incidents is lower.Casualties per 1,000 incidents in Anaheim, CA compared to nearest cities:
(Note: Based on data for all years, including only cities with at least 500 fire incidents)
| Anaheim: | 4.3 |
| Placentia: | 15.9 |
| Fullerton: | 5.1 |
| Orange: | 4.6 |
| Garden Grove: | 24.0 |
| Stanton: | 24.7 |
| Santa Ana: | 16.8 |
| Buena Park: | 22.3 |
| Yorba Linda: | 11.7 |
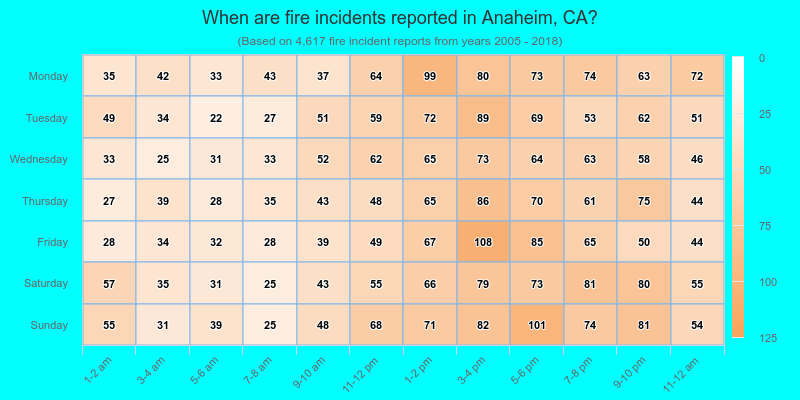
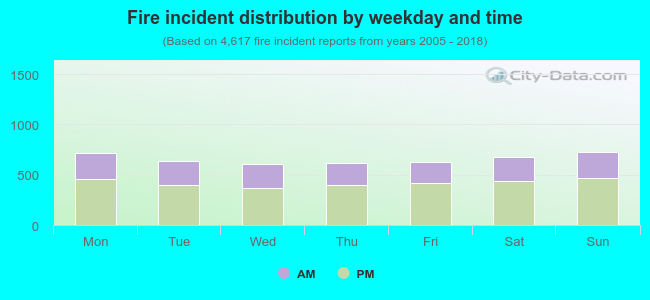 36.3% incidents where reported in the morning and 63.7% in the evening. The most fires (15.8%) took place on Sunday, and the least (13.1%) on Wednesday.
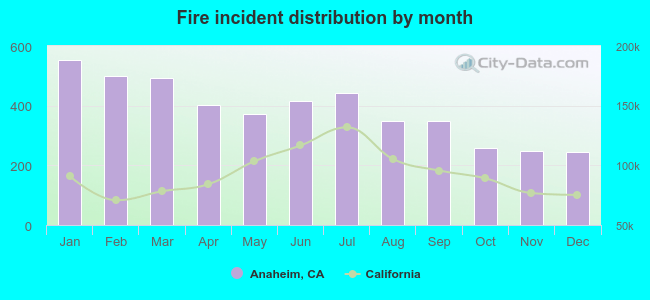 According to the 4,617 fire incident reports from years 2005 - 2018 most fires (12.0%) took place during January, and the least (5.3%) in December.
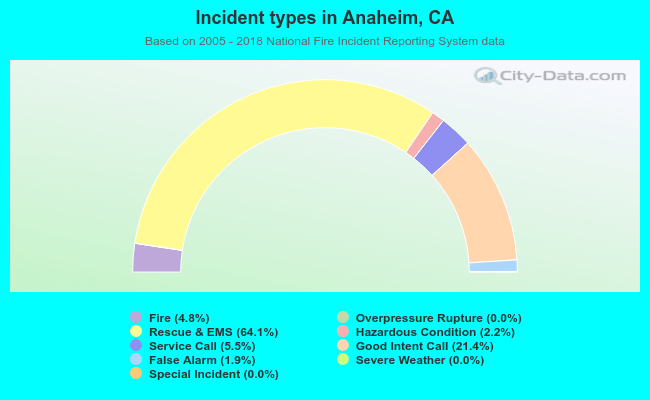 Out of all 96,522 cases reported during the years 2005 - 2018, the most belonged to the categories: Rescue & EMS (64.1%), Good Intent Call (21.4%), and Service Call (5.5%).
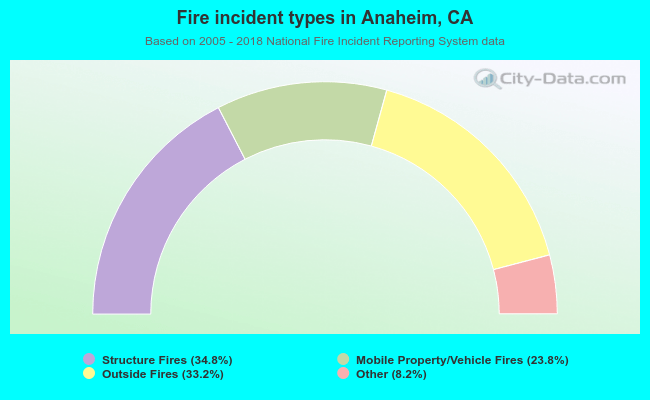 When looking into fire subcategories, the most incidents belonged to: Structure Fires (34.8%), and Outside Fires (33.2%).