Orange: Fire Incidents, California (CA)
Where are fire incidents reported in Orange, CA
Something went wrong! Please refresh the page.
| Fire incidents reported | |
|---|---|
| Sreet name | Count |
| CHAPMAN AVE | 150 |
| TUSTIN ST | 128 |
| GLASSELL ST | 74 |
| BATAVIA ST | 68 |
| CHAPMAN | 58 |
| MAIN ST | 58 |
| KATELLA AVE | 50 |
| LA VETA AVE | 40 |
| PALMYRA AVE | 34 |
| SB 55 FY | 34 |
| CYPRESS ST | 32 |
| COLLINS AVE | 30 |
| W CHAPMAN AV | 30 |
| E CHAPMAN AV | 28 |
| N TUSTIN ST | 26 |
| SHAFFER ST | 26 |
| NB 55 FY | 24 |
| LEMON ST | 22 |
| PALM AVE | 22 |
| WB 22 FY | 22 |
| FAIRWAY DR | 20 |
| HIGHLAND ST | 20 |
| IRVINE PARK RD | 20 |
| SB 57 FY | 20 |
| EB 22 FY | 18 |
| GLASSELL | 18 |
| WILSON AVE | 18 |
| ADELE ST | 16 |
| CAMBRIDGE ST | 16 |
| CHESTNUT AVE | 16 |
| Other | 604 |
2005 - 2018 National Fire Incident Reporting System (NFIRS) incidents
- Incident types reported to NFIRS in Orange, CA
- 8,02553.4%Rescue & EMS
- 2,56117.0%Good Intent Call
- 1,74211.6%Fire
- 1,1307.5%Hazardous Condition
- 1,1027.3%Service Call
- 4322.9%False Alarm
- 210.1%Special Incident
- Fire incident types reported to NFIRS in Orange, CA
- 61635.4%Outside Fires
- 56732.5%Structure Fires
- 42524.4%Mobile Property/Vehicle Fires
- 1347.7%Other
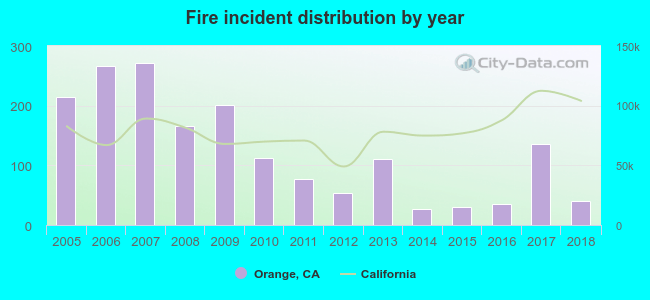 Based on the data from the years 2005 - 2018 the average number of fires per year is 124. The highest number of reported fire incidents - 272 took place in 2007, and the least - 26 in 2014. The data has a declining trend.
The average number of yearly fire incidents per 10k residents in Orange, CA compared to nearest cities:
(Note: Based on data for the last 3 years, including only cities with population 5,000 and above)
| Orange: | 5.0 |
| Villa Park: | 6.7 |
| North Tustin: | 0.8 |
| Anaheim: | 11.0 |
| Tustin: | 12.4 |
| Santa Ana: | 14.7 |
| Placentia: | 8.7 |
| Yorba Linda: | 6.8 |
| Garden Grove: | 3.6 |
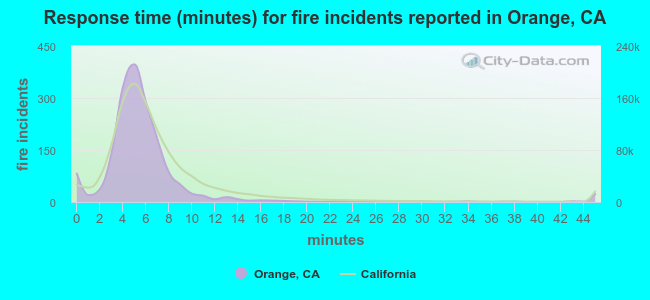 The median response time based on all reported fire incidents is 5 minutes. This is lower than the state median value.
The median response time in Orange, CA compared to nearest cities:
(Note: Based on data for all years, including only cities with at least 500 fire incidents)
| Orange: | 5 minutes |
| Anaheim: | 6 minutes |
| Tustin: | 6 minutes |
| Santa Ana: | 5 minutes |
| Placentia: | 5 minutes |
| Yorba Linda: | 7 minutes |
| Garden Grove: | 6 minutes |
| Fullerton: | 6 minutes |
| Irvine: | 6 minutes |
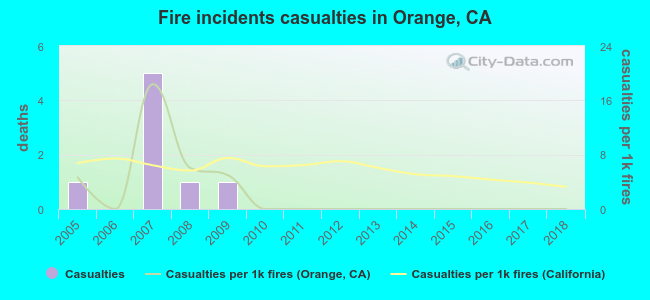 According to the reports from the years 2005 - 2018 the average number of fire-related yearly casualties is 1. The highest number of reported injuries - 5 took place in 2007, and the lowest - 0 in 2006. The data has a declining trend.
The average number of casualties per 1,000 fire incidents is 2. This indicator was the highest - 18 in 2007, and the lowest 0 in 2006. The trend for casualties per 1,000 fire incidents is declining. Compared to the California value the number of injuries per 1,000 incidents is lower.
According to the reports from the years 2005 - 2018 the average number of fire-related yearly casualties is 1. The highest number of reported injuries - 5 took place in 2007, and the lowest - 0 in 2006. The data has a declining trend.
The average number of casualties per 1,000 fire incidents is 2. This indicator was the highest - 18 in 2007, and the lowest 0 in 2006. The trend for casualties per 1,000 fire incidents is declining. Compared to the California value the number of injuries per 1,000 incidents is lower.Casualties per 1,000 incidents in Orange, CA compared to nearest cities:
(Note: Based on data for all years, including only cities with at least 500 fire incidents)
| Orange: | 4.6 |
| Anaheim: | 4.3 |
| Tustin: | 20.1 |
| Santa Ana: | 16.8 |
| Placentia: | 15.9 |
| Yorba Linda: | 11.7 |
| Garden Grove: | 24.0 |
| Fullerton: | 5.1 |
| Irvine: | 15.1 |
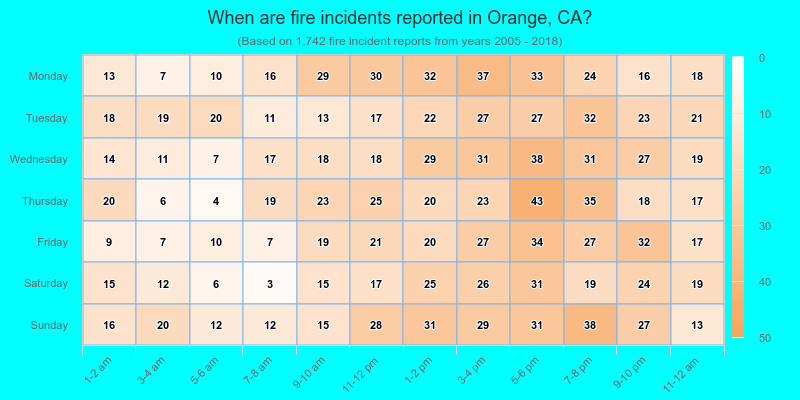
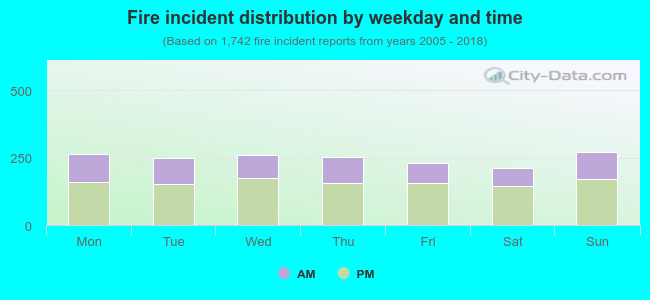 36.1% incidents where reported in the morning and 63.9% in the evening. The most fires (15.6%) took place on Sunday, and the least (12.2%) on Saturday.
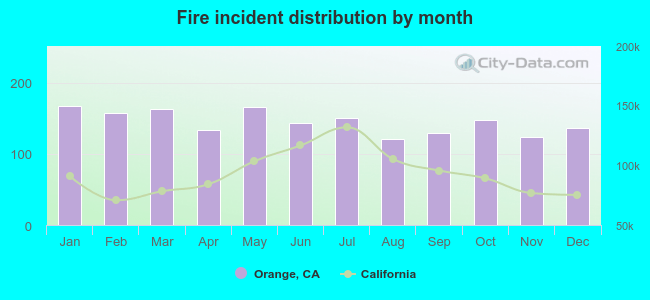 Based on the 1,742 fire incidents from years 2005 - 2018 most fires (9.6%) took place during January, and the least (6.9%) in August.
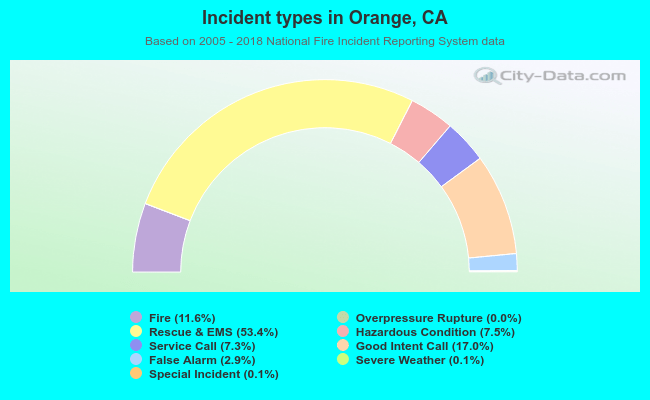 Out of all 15,025 cases reported during the years 2005 - 2018, the most belonged to the categories: Rescue & EMS (53.4%), Good Intent Call (17.0%), and Fire (11.6%).
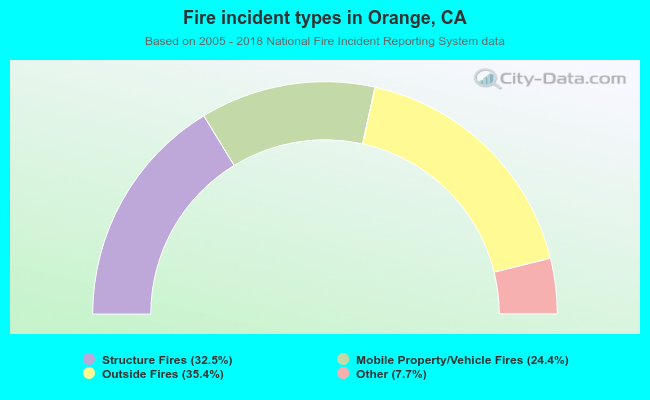 When looking into fire subcategories, the most incidents belonged to: Outside Fires (35.4%), and Structure Fires (32.5%).