Midway City: Fire Incidents, California (CA)
Where are fire incidents reported in Midway City, CA
Something went wrong! Please refresh the page.
|
| |||||||||||||||||||||||||||||||||||||||||||||||||||||||||||||||||||||||||||||||||||||||||||||||||
2005 - 2018 National Fire Incident Reporting System (NFIRS) incidents
- Incident types reported to NFIRS in Midway City, CA
- 2,14379.0%Rescue & EMS
- 1686.2%Service Call
- 1505.5%Good Intent Call
- 1094.0%Fire
- 1043.8%Hazardous Condition
- 331.2%False Alarm
- 30.1%Overpressure Rupture
- Fire incident types reported to NFIRS in Midway City, CA
- 5146.8%Outside Fires
- 3128.4%Structure Fires
- 2321.1%Mobile Property/Vehicle Fires
- 43.7%Other
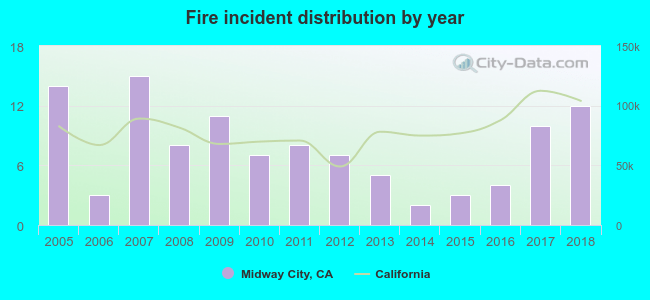 According to the data from the years 2005 - 2018 the average number of fire incidents per year is 8. The highest number of reported fires - 15 took place in 2007, and the least - 2 in 2014. The data has a dropping trend.
The average number of yearly fire incidents per 10k residents in Midway City, CA compared to nearest cities:
(Note: Based on data for the last 3 years, including only cities with population 5,000 and above)
| Midway City: | 10.2 |
| Westminster: | 13.8 |
| Garden Grove: | 3.6 |
| Fountain Valley: | 2.5 |
| Huntington Beach: | 2.7 |
| Stanton: | 12.4 |
| Seal Beach: | 17.8 |
| Cypress: | 8.7 |
| Los Alamitos: | 16.2 |
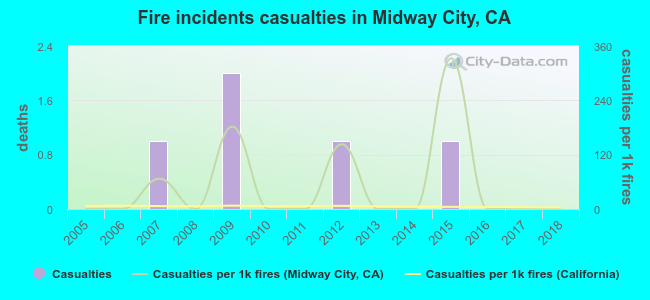 According to the data from the years 2005 - 2018 the average number of fire-related casualties per year is 0. The highest number of reported injuries - 2 took place in 2009, and the lowest - 0 in 2005. The data has a constant trend.
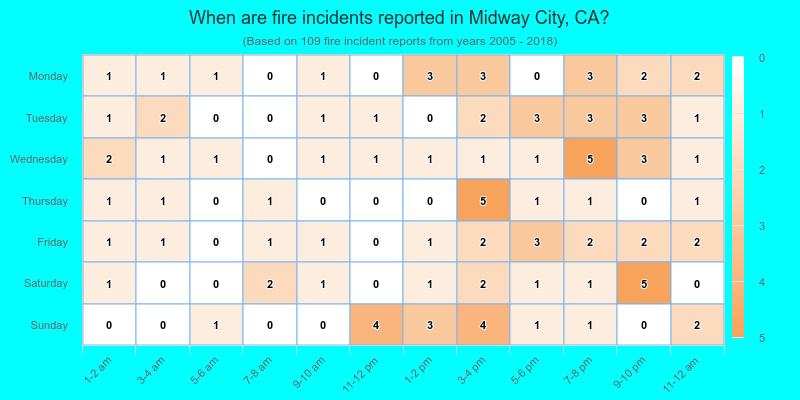
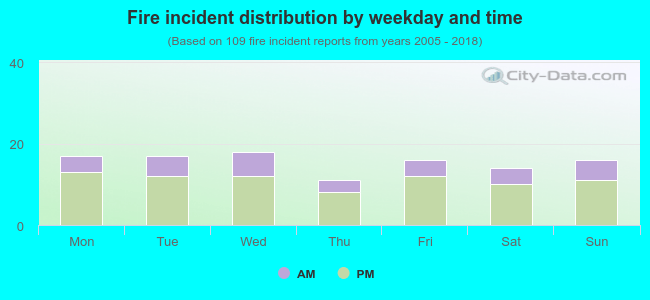 28.4% incidents where reported in the morning and 71.6% in the evening. The most fires (16.5%) took place on Wednesday, and the least (10.1%) on Thursday.
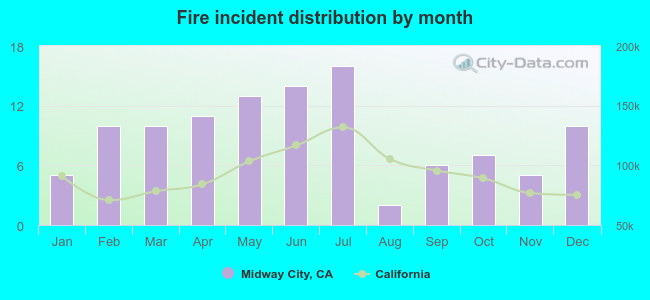 Based on the 109 fire incident reports from years 2005 - 2018 most fires (14.7%) took place during July, and the least (1.8%) in August.
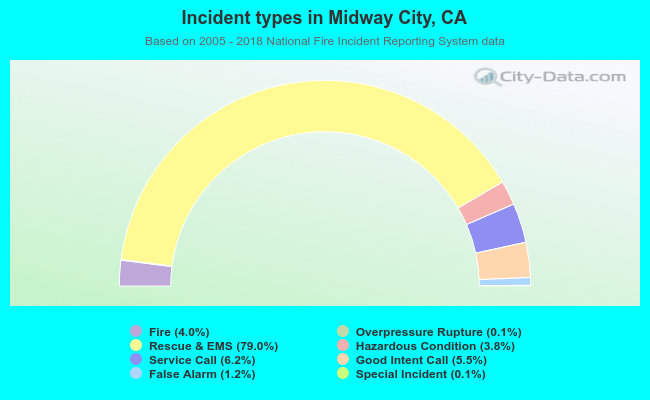 Out of all 2,712 cases reported during the years 2005 - 2018, the most belonged to the categories: Rescue & EMS (79.0%), Service Call (6.2%), and Good Intent Call (5.5%).
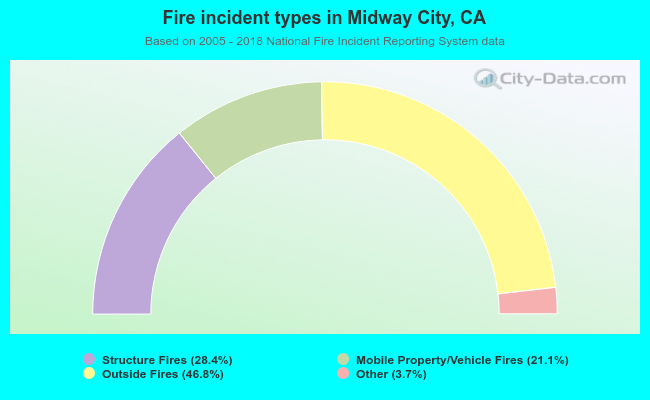 When looking into fire subcategories, the most reports belonged to: Outside Fires (46.8%), and Structure Fires (28.4%).