Huntington Beach: Fire Incidents, California (CA)
Where are fire incidents reported in Huntington Beach, CA
Something went wrong! Please refresh the page.
| Fire incidents reported | |
|---|---|
| Sreet name | Count |
| BEACH BLVD | 142 |
| WARNER AVE | 128 |
| PCH | 118 |
| BROOKHURST ST | 96 |
| EDINGER AVE | 76 |
| ADAMS AVE | 54 |
| GOTHARD ST | 52 |
| GOLDENWEST ST | 48 |
| YORKTOWN AVE | 44 |
| HEIL AVE | 32 |
| EDINGER | 30 |
| FLORIDA ST | 30 |
| HUNTINGTON ST | 30 |
| MAIN ST | 30 |
| OCEANFRONT | 30 |
| GARFIELD AVE | 28 |
| ALABAMA ST | 26 |
| NEWLAND ST | 26 |
| BEACH | 24 |
| TALBERT AVE | 24 |
| DELAWARE ST | 22 |
| MAGNOLIA AVE | 22 |
| LAKE ST | 20 |
| SPRINGDALE ST | 20 |
| VIEWPOINT LANE | 20 |
| GOTHARD ST / EDINGER AV | 18 |
| BEACH BL / TALBERT AV | 16 |
| BOLSA CHICA ST | 16 |
| INDIANAPOLIS AVE | 16 |
| MC FADDEN AVE | 16 |
| Other | 930 |
2005 - 2018 National Fire Incident Reporting System (NFIRS) incidents
- Incident types reported to NFIRS in Huntington Beach, CA
- 5,10846.5%Rescue & EMS
- 2,18419.9%Fire
- 1,63814.9%Good Intent Call
- 1,41312.9%Hazardous Condition
- 4424.0%Service Call
- 1971.8%False Alarm
- Fire incident types reported to NFIRS in Huntington Beach, CA
- 86339.5%Structure Fires
- 75834.7%Outside Fires
- 33015.1%Mobile Property/Vehicle Fires
- 23310.7%Other
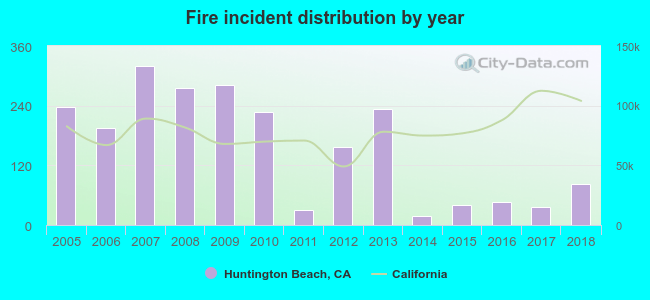 According to the data from the years 2005 - 2018 the average number of fires per year is 156. The highest number of fire incidents - 320 took place in 2007, and the least - 19 in 2014. The data has a decreasing trend.
The average number of yearly fire incidents per 10k residents in Huntington Beach, CA compared to nearest cities:
(Note: Based on data for the last 3 years, including only cities with population 5,000 and above)
| Huntington Beach: | 2.7 |
| Fountain Valley: | 2.5 |
| Midway City: | 10.2 |
| Westminster: | 13.8 |
| Costa Mesa: | 17.6 |
| Garden Grove: | 3.6 |
| Seal Beach: | 17.8 |
| Stanton: | 12.4 |
| Santa Ana: | 14.7 |
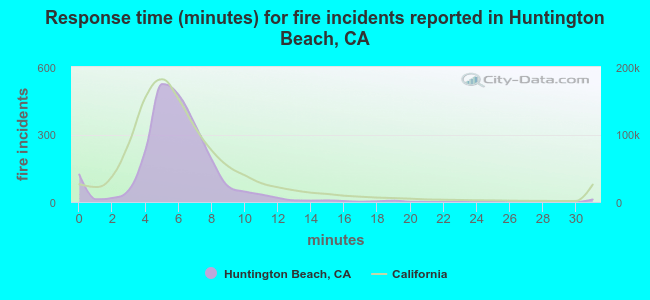 The median response time based on all reported fire incidents is 6 minutes. This is about the same as the California median value.
The median response time in Huntington Beach, CA compared to nearest cities:
(Note: Based on data for all years, including only cities with at least 500 fire incidents)
| Huntington Beach: | 6 minutes |
| Fountain Valley: | 6 minutes |
| Westminster: | 5 minutes |
| Costa Mesa: | 5 minutes |
| Garden Grove: | 6 minutes |
| Seal Beach: | 5 minutes |
| Stanton: | 5 minutes |
| Santa Ana: | 5 minutes |
| Newport Beach: | 6 minutes |
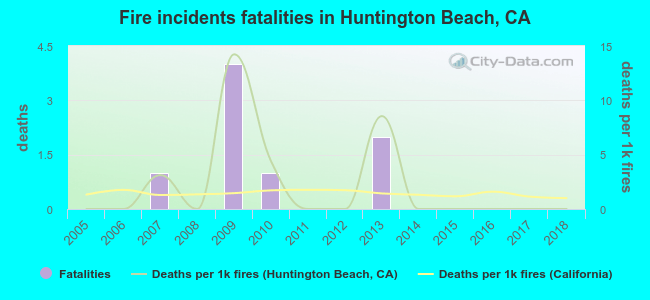 According to the reports from the years 2005 - 2018 the average number of fire-related yearly deaths is 1. The highest number of deaths - 4 took place in 2009, and the lowest - 0 in 2005. The data has a constant trend.
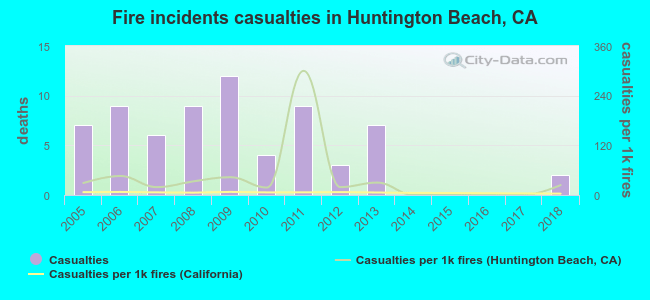 Based on the data from the years 2005 - 2018 the average number of fire-related casualties per year is 5. The highest number of injuries - 12 took place in 2009, and the lowest - 0 in 2014. The data has a decreasing trend.
The average number of casualties per 1,000 fire incidents is 40. This indicator was the highest - 300 in 2011, and the lowest 0 in 2014. The trend for injuries per 1,000 incidents is declining. Compared to the California value the number of casualties per 1,000 incidents is much higher.
Based on the data from the years 2005 - 2018 the average number of fire-related casualties per year is 5. The highest number of injuries - 12 took place in 2009, and the lowest - 0 in 2014. The data has a decreasing trend.
The average number of casualties per 1,000 fire incidents is 40. This indicator was the highest - 300 in 2011, and the lowest 0 in 2014. The trend for injuries per 1,000 incidents is declining. Compared to the California value the number of casualties per 1,000 incidents is much higher.Casualties per 1,000 incidents in Huntington Beach, CA compared to nearest cities:
(Note: Based on data for all years, including only cities with at least 500 fire incidents)
| Huntington Beach: | 31.1 |
| Fountain Valley: | 31.9 |
| Westminster: | 24.0 |
| Costa Mesa: | 16.4 |
| Garden Grove: | 24.0 |
| Seal Beach: | 11.6 |
| Stanton: | 24.7 |
| Santa Ana: | 16.8 |
| Newport Beach: | 3.6 |
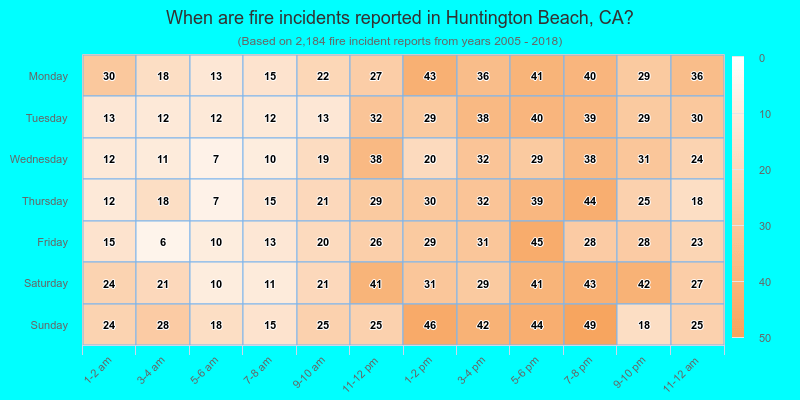
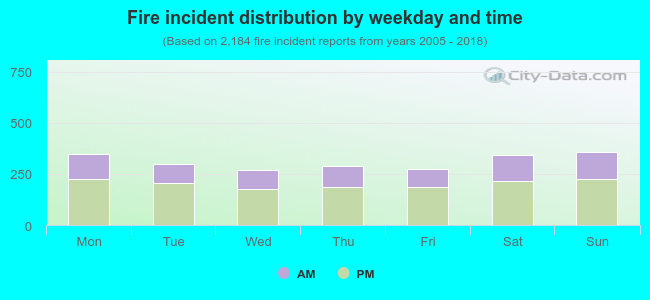 35.3% incidents where reported in the morning and 64.7% in the evening. The most fires (16.4%) took place on Sunday, and the least (12.4%) on Wednesday.
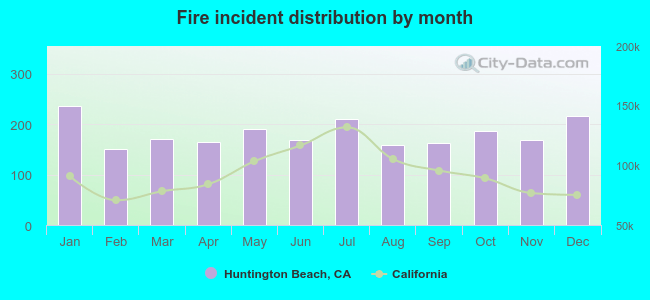 According to the 2,184 fires from years 2005 - 2018 most fires (10.9%) took place during January, and the least (6.9%) in February.
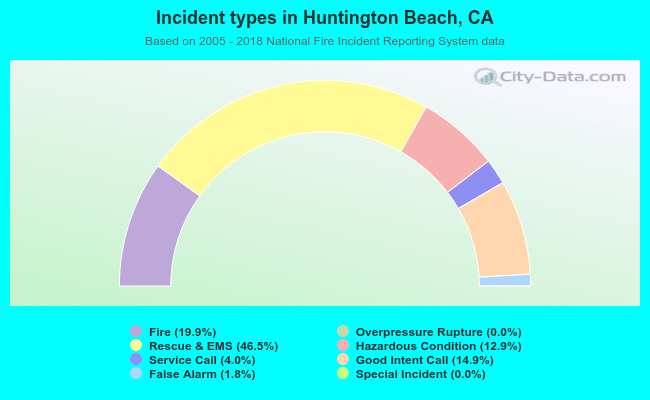 Out of all 10,988 cases reported during the years 2005 - 2018, the most belonged to the categories: Rescue & EMS (46.5%), Fire (19.9%), and Good Intent Call (14.9%).
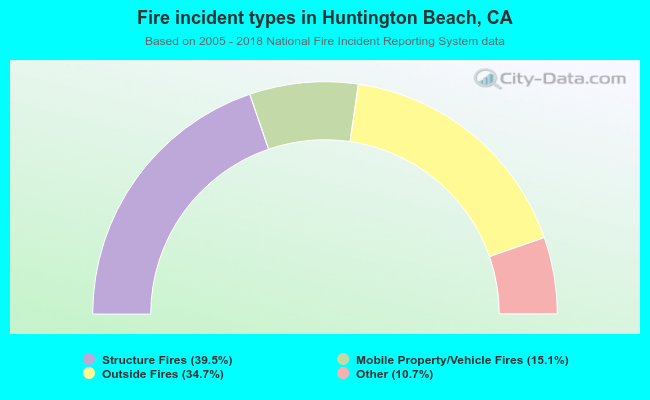 When looking into fire subcategories, the most incidents belonged to: Structure Fires (39.5%), and Outside Fires (34.7%).