Red Wing: Fire Incidents, Minnesota (MN)
Where are fire incidents reported in Red Wing, MN
Something went wrong! Please refresh the page.
| Fire incidents reported | |
|---|---|
| Sreet name | Count |
| PIONEER RD | 54 |
| BUSH ST | 52 |
| 5TH ST | 50 |
| 7TH ST | 50 |
| BENCH ST | 50 |
| MAIN ST | 40 |
| TYLER RD | 40 |
| MAPLE ST | 36 |
| 4TH ST | 32 |
| EAST AVE | 32 |
| PLUM ST | 30 |
| 3RD ST | 26 |
| FRENN AVE | 26 |
| HIGHWAY 61 BLVD | 24 |
| 6TH ST | 22 |
| OLD WEST MAIN ST | 22 |
| SOUTH PARK ST | 20 |
| MALMQUIST AVE | 16 |
| 9TH ST | 12 |
| CHAKYA AVE | 12 |
| COTTONWOOD AVE | 12 |
| FEATHERSTONE RD | 12 |
| HIGHWAY 61 | 12 |
| SARGENT DR | 12 |
| SERVICE DR | 12 |
| STURGEON LAKE RD | 12 |
| WEST AVE | 12 |
| CENTRAL AVE | 10 |
| HIGHWAY 35 | 10 |
| LAGRANGE ST | 10 |
2002 - 2018 National Fire Incident Reporting System (NFIRS) incidents
- Incident types reported to NFIRS in Red Wing, MN
- 6,47067.9%Rescue & EMS
- 9279.7%Hazardous Condition
- 7017.4%Fire
- 6216.5%False Alarm
- 4795.0%Good Intent Call
- 2833.0%Service Call
- 240.3%Overpressure Rupture
- 200.2%Special Incident
- Fire incident types reported to NFIRS in Red Wing, MN
- 28941.2%Structure Fires
- 23233.1%Outside Fires
- 14120.1%Mobile Property/Vehicle Fires
- 395.6%Other
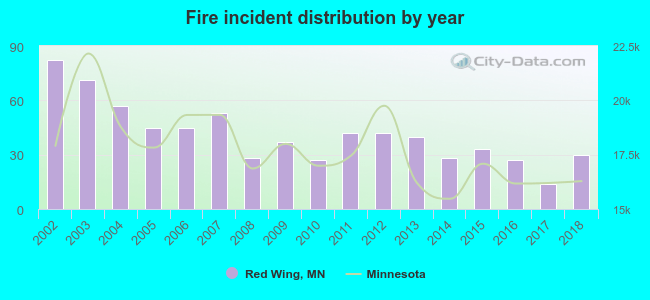 Based on the data from the years 2002 - 2018 the average number of fire incidents per year is 41. The highest number of reported fire incidents - 82 took place in 2002, and the least - 14 in 2017. The data has a decreasing trend.
The average number of yearly fire incidents per 10k residents in Red Wing, MN compared to nearest cities:
(Note: Based on data for the last 3 years, including only cities with population 5,000 and above)
| Red Wing: | 14.4 |
| Hastings: | 30.7 |
| Cottage Grove: | 12.2 |
| Farmington: | 18.0 |
| Rosemount: | 14.5 |
| Northfield: | 30.0 |
| Inver Grove Heights: | 20.9 |
| Woodbury: | 7.7 |
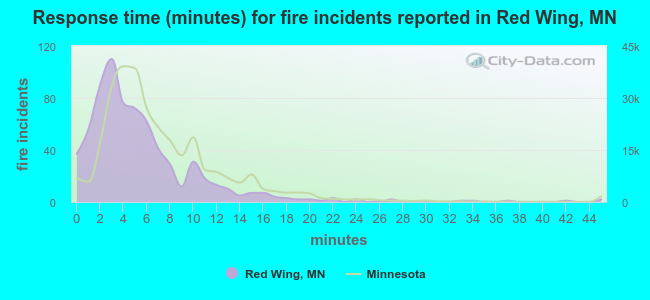 The median response time based on all reported fire incidents is 4 minutes. This is lower compared to the state median value.
The median response time in Red Wing, MN compared to nearest cities:
(Note: Based on data for all years, including only cities with at least 500 fire incidents)
| Red Wing: | 4 minutes |
| Hastings: | 6 minutes |
| Cottage Grove: | 7 minutes |
| Farmington: | 6 minutes |
| Northfield: | 8 minutes |
| Inver Grove Heights: | 7 minutes |
| Woodbury: | 6 minutes |
| South St. Paul: | 3 minutes |
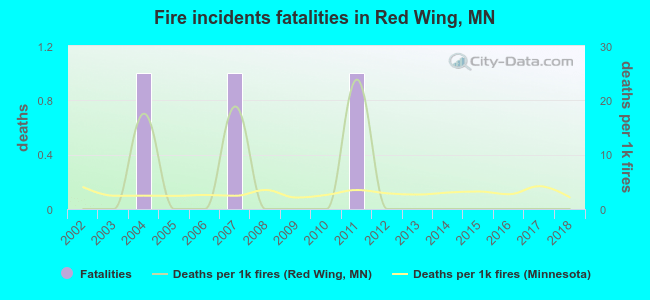 Based on the data from the years 2002 - 2018 the average number of fire-related fatalities per year is 0. The highest number of deaths - 1 took place in 2004, and the lowest - 0 in 2002. The data has a constant trend.
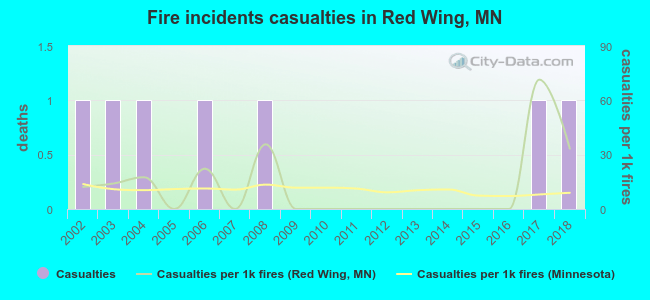 According to the data from the years 2002 - 2018 the average number of fire-related casualties per year is 0. The highest number of reported casualties - 1 took place in 2002, and the lowest - 0 in 2005. The data has a constant trend.
The average number of casualties per 1,000 fires is 12. This indicator was the highest - 71 in 2017, and the lowest 0 in 2005. The trend for injuries per 1,000 incidents is rising. Compared to the state value the number of injuries per 1,000 fires is similar.
According to the data from the years 2002 - 2018 the average number of fire-related casualties per year is 0. The highest number of reported casualties - 1 took place in 2002, and the lowest - 0 in 2005. The data has a constant trend.
The average number of casualties per 1,000 fires is 12. This indicator was the highest - 71 in 2017, and the lowest 0 in 2005. The trend for injuries per 1,000 incidents is rising. Compared to the state value the number of injuries per 1,000 fires is similar.Casualties per 1,000 incidents in Red Wing, MN compared to nearest cities:
(Note: Based on data for all years, including only cities with at least 500 fire incidents)
| Red Wing: | 10.0 |
| Hastings: | 10.6 |
| Cottage Grove: | 1.1 |
| Farmington: | 7.8 |
| Northfield: | 23.8 |
| Inver Grove Heights: | 5.1 |
| Woodbury: | 12.2 |
| South St. Paul: | 3.8 |
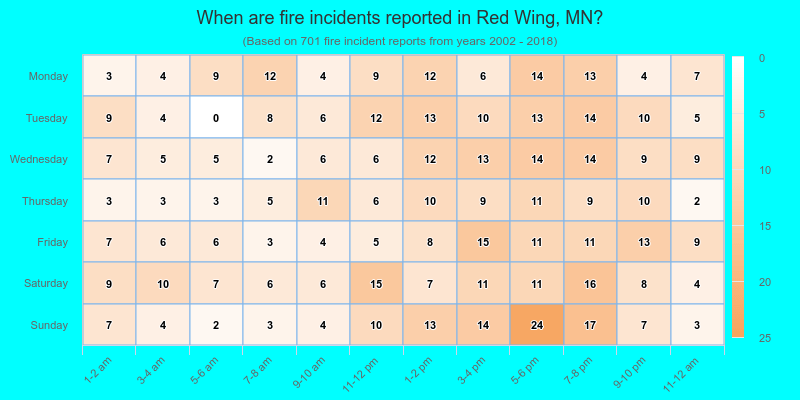
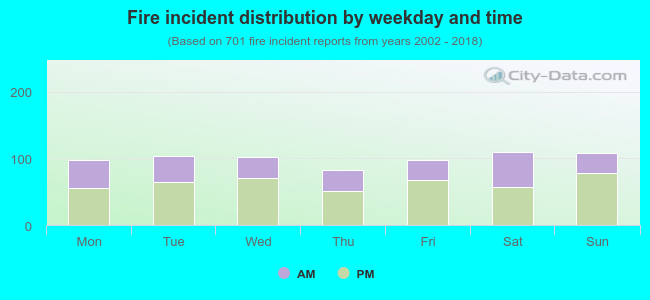 36.5% incidents where reported in the morning and 63.5% in the evening. The most fires (15.7%) took place on Saturday, and the least (11.7%) on Thursday.
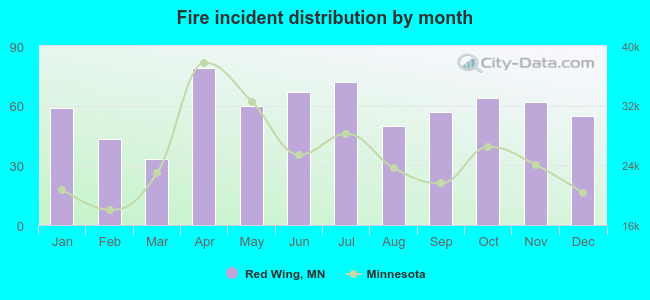 According to the 701 fire incidents from years 2002 - 2018 most fires (11.3%) took place during April, and the least (4.7%) in March.
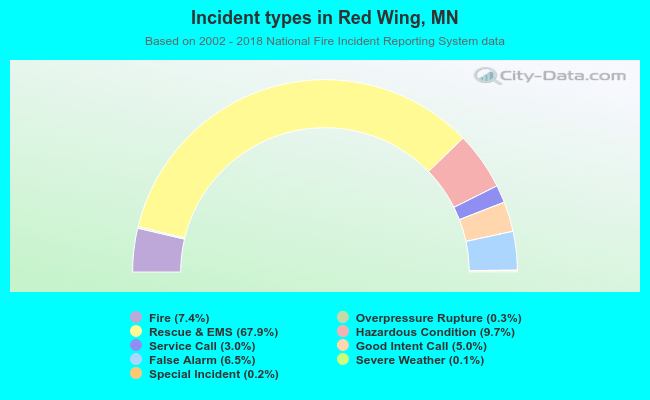 Out of all 9,531 cases reported during the years 2002 - 2018, the most belonged to the categories: Rescue & EMS (67.9%), Hazardous Condition (9.7%), and Fire (7.4%).
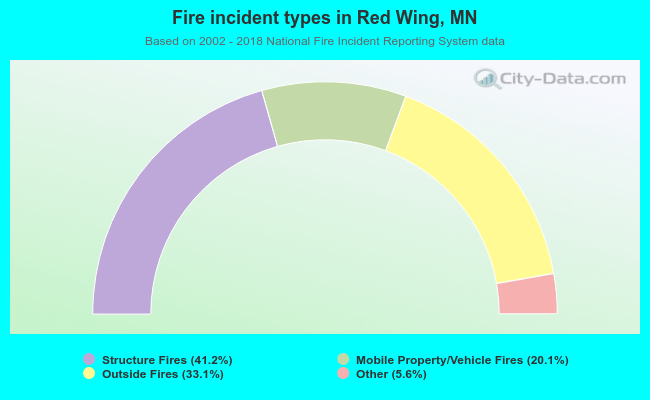 When looking into fire subcategories, the most reports belonged to: Structure Fires (41.2%), and Outside Fires (33.1%).