Woodbury: Fire Incidents, Minnesota (MN)
Where are fire incidents reported in Woodbury, MN
Something went wrong! Please refresh the page.
| Fire incidents reported | |
|---|---|
| Sreet name | Count |
| I94 | 116 |
| HUDSON RD | 58 |
| I494 | 52 |
| RADIO DR | 46 |
| ASHWOOD RD | 44 |
| VALLEY CREEK RD | 40 |
| WEIR DR | 36 |
| TAMARACK VLG | 32 |
| WOODLANE DR | 30 |
| MANNING AVE | 28 |
| LAKE RD | 26 |
| WOODBURY DR | 26 |
| BAILEY RD | 22 |
| SILVERWOOD RD | 22 |
| CENTURY AVE | 20 |
| WIMBLEDON DR | 20 |
| CITY WALK DR | 18 |
| OJIBWAY DR | 18 |
| CENTURY CIR | 16 |
| COTTAGE GROVE DR | 16 |
| PARKWOOD DR | 16 |
| DALE RD | 14 |
| GLEN RD | 14 |
| GRAND OAKS TRL | 14 |
| KINGSFIELD LN | 14 |
| TAMARACK VILLAGE | 14 |
| TOWER DR | 14 |
| VALLEY CREEK PLZ | 14 |
| GUIDER DR | 12 |
| TAMARACK RD | 12 |
| Other | 163 |
2002 - 2018 National Fire Incident Reporting System (NFIRS) incidents
- Incident types reported to NFIRS in Woodbury, MN
- 18,16571.9%Rescue & EMS
- 2,3489.3%Good Intent Call
- 1,7546.9%Hazardous Condition
- 1,5566.2%False Alarm
- 9873.9%Fire
- 4211.7%Service Call
- Fire incident types reported to NFIRS in Woodbury, MN
- 50951.6%Structure Fires
- 24624.9%Outside Fires
- 22622.9%Mobile Property/Vehicle Fires
- 60.6%Other
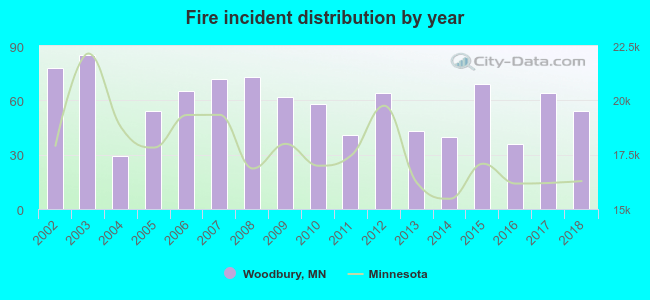 According to the data from the years 2002 - 2018 the average number of fire incidents per year is 58. The highest number of fires - 85 took place in 2003, and the least - 29 in 2004. The data has a decreasing trend.
The average number of yearly fire incidents per 10k residents in Woodbury, MN compared to nearest cities:
(Note: Based on data for the last 3 years, including only cities with population 5,000 and above)
| Woodbury: | 7.7 |
| Oakdale: | 18.4 |
| Lake Elmo: | 38.5 |
| Cottage Grove: | 12.2 |
| Maplewood: | 31.1 |
| Inver Grove Heights: | 20.9 |
| Mahtomedi: | 12.8 |
| Mendota Heights: | 15.1 |
| Little Canada: | 43.0 |
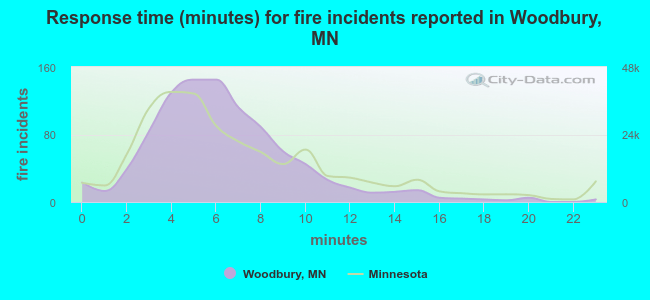 The median response time based on all reported fire incidents is 6 minutes. This is similar to the Minnesota median value.
The median response time in Woodbury, MN compared to nearest cities:
(Note: Based on data for all years, including only cities with at least 500 fire incidents)
| Woodbury: | 6 minutes |
| Oakdale: | 5 minutes |
| Lake Elmo: | 7 minutes |
| South St. Paul: | 3 minutes |
| Cottage Grove: | 7 minutes |
| Maplewood: | 5 minutes |
| Inver Grove Heights: | 7 minutes |
| Little Canada: | 3 minutes |
| Stillwater: | 6 minutes |
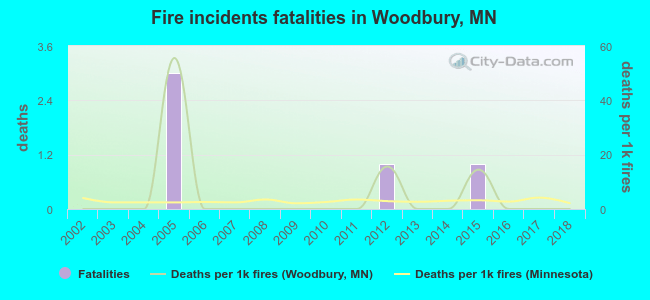 Based on the reports from the years 2002 - 2018 the average number of fire-related fatalities per year is 0. The highest number of reported deaths - 3 took place in 2005, and the lowest - 0 in 2002. The data has a constant trend.
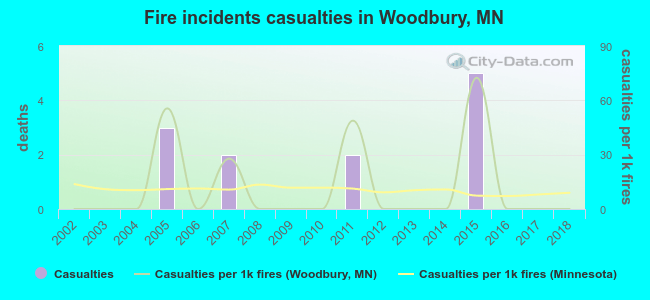 Based on the reports from the years 2002 - 2018 the average number of fire-related casualties per year is 1. The highest number of injuries - 5 took place in 2015, and the lowest - 0 in 2002. The data has a constant trend.
The average number of injuries per 1,000 fires is 12. This indicator was the highest - 72 in 2015, and the lowest 0 in 2002. The trend for casualties per 1,000 fires is constant. Compared to the Minnesota value the number of casualties per 1,000 incidents is similar.
Based on the reports from the years 2002 - 2018 the average number of fire-related casualties per year is 1. The highest number of injuries - 5 took place in 2015, and the lowest - 0 in 2002. The data has a constant trend.
The average number of injuries per 1,000 fires is 12. This indicator was the highest - 72 in 2015, and the lowest 0 in 2002. The trend for casualties per 1,000 fires is constant. Compared to the Minnesota value the number of casualties per 1,000 incidents is similar.Casualties per 1,000 incidents in Woodbury, MN compared to nearest cities:
(Note: Based on data for all years, including only cities with at least 500 fire incidents)
| Woodbury: | 12.2 |
| Oakdale: | 11.8 |
| Lake Elmo: | 7.0 |
| South St. Paul: | 3.8 |
| Cottage Grove: | 1.1 |
| Maplewood: | 5.2 |
| Inver Grove Heights: | 5.1 |
| Little Canada: | 2.6 |
| Stillwater: | 22.3 |
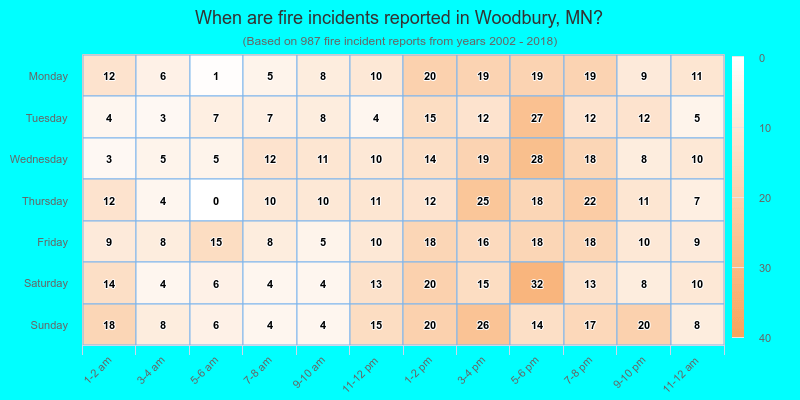
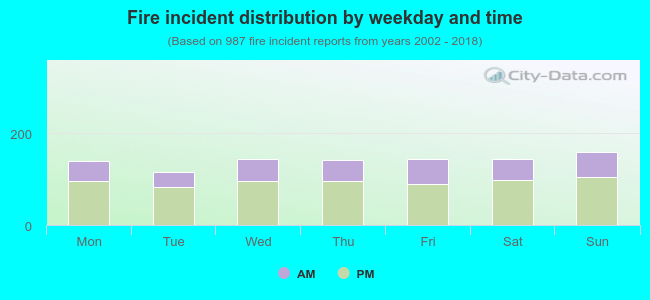 32.7% incidents where reported in the morning and 67.3% in the evening. The most fires (16.2%) took place on Sunday, and the least (11.8%) on Tuesday.
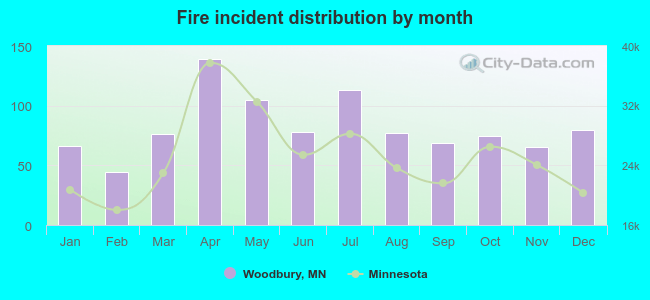 According to the 987 fire incident reports from years 2002 - 2018 most fires (14.1%) took place during April, and the least (4.5%) in February.
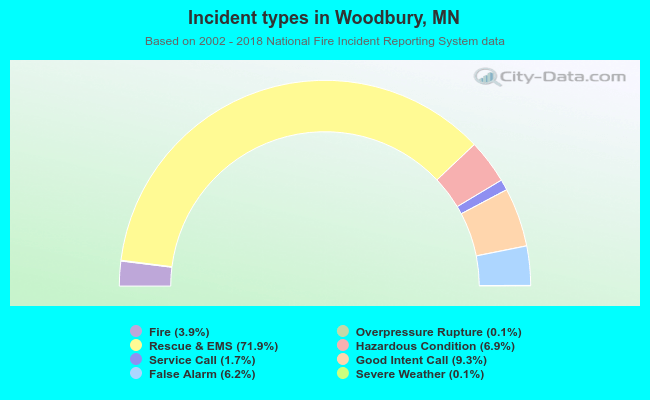 Out of all 25,273 cases reported during the years 2002 - 2018, the most belonged to the categories: Rescue & EMS (71.9%), Good Intent Call (9.3%), and Hazardous Condition (6.9%).
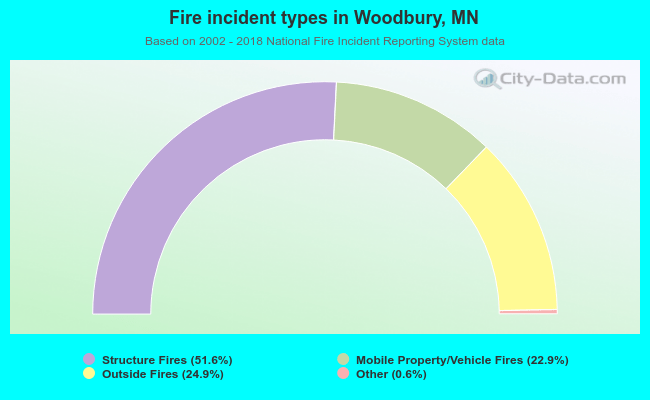 When looking into fire subcategories, the most reports belonged to: Structure Fires (51.6%), and Outside Fires (24.9%).