Inver Grove Heights: Fire Incidents, Minnesota (MN)
Where are fire incidents reported in Inver Grove Heights, MN
Something went wrong! Please refresh the page.
| Fire incidents reported | |
|---|---|
| Sreet name | Count |
| AUDOBON AVE | 114 |
| CONCORD BLVD | 100 |
| 65TH ST | 94 |
| 117TH ST | 68 |
| CAHILL AVE | 54 |
| COURTHOUSE BLVD | 54 |
| 78TH ST | 52 |
| UPPER 55TH ST | 52 |
| 66TH ST | 44 |
| BABCOCK TRL | 42 |
| HWY 52 | 40 |
| 70TH ST | 36 |
| 80TH ST | 36 |
| COLLEGE TRL | 36 |
| SOUTH ROBERT TRL | 36 |
| BLAINE AVE | 34 |
| DICKMAN TRL | 34 |
| DOFFING AVE | 34 |
| BARBARA AVE | 32 |
| ROBERT TRL | 32 |
| 52ND ST | 30 |
| BRENT AVE | 28 |
| RIVER RD | 28 |
| AUDOBON AV | 26 |
| INVER GROVE TRL | 26 |
| 50TH ST | 24 |
| ARGENTA TRL | 24 |
| ASHLEY LANE | 22 |
| BRODERICK BLVD | 22 |
| DENTON WAY | 22 |
| Other | 95 |
2002 - 2018 National Fire Incident Reporting System (NFIRS) incidents
- Incident types reported to NFIRS in Inver Grove Heights, MN
- 3,91144.6%Rescue & EMS
- 1,37115.6%Fire
- 1,22514.0%Hazardous Condition
- 1,02011.6%Good Intent Call
- 94610.8%False Alarm
- 2663.0%Service Call
- 200.2%Overpressure Rupture
- Fire incident types reported to NFIRS in Inver Grove Heights, MN
- 60944.4%Structure Fires
- 37727.5%Outside Fires
- 34925.5%Mobile Property/Vehicle Fires
- 362.6%Other
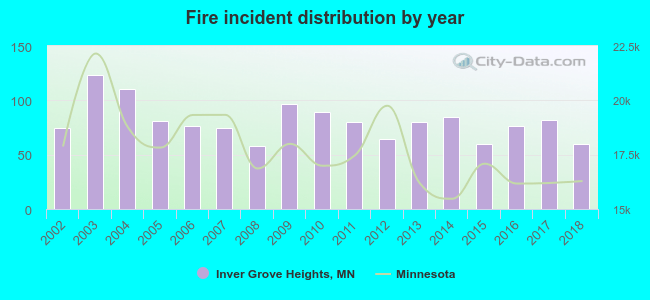 Based on the data from the years 2002 - 2018 the average number of fire incidents per year is 81. The highest number of reported fires - 123 took place in 2003, and the least - 58 in 2008. The data has a dropping trend.
The average number of yearly fire incidents per 10k residents in Inver Grove Heights, MN compared to nearest cities:
(Note: Based on data for the last 3 years, including only cities with population 5,000 and above)
| Inver Grove Heights: | 20.9 |
| Mendota Heights: | 15.1 |
| Cottage Grove: | 12.2 |
| Eagan: | 12.1 |
| Rosemount: | 14.5 |
| Woodbury: | 7.7 |
| Apple Valley: | 16.2 |
| Maplewood: | 31.1 |
| Oakdale: | 18.4 |
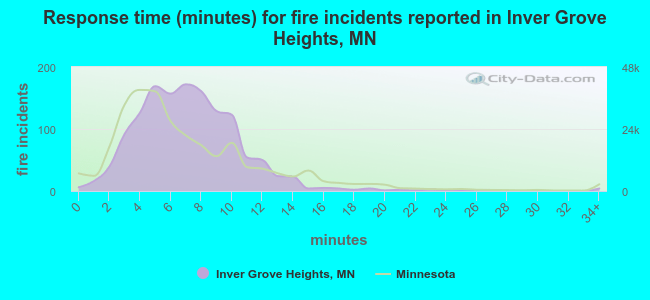 The median response time based on all reported fire incidents is 7 minutes. This is comparable to the Minnesota median value.
The median response time in Inver Grove Heights, MN compared to nearest cities:
(Note: Based on data for all years, including only cities with at least 500 fire incidents)
| Inver Grove Heights: | 7 minutes |
| South St. Paul: | 3 minutes |
| Cottage Grove: | 7 minutes |
| Eagan: | 6 minutes |
| Woodbury: | 6 minutes |
| Apple Valley: | 5 minutes |
| Maplewood: | 5 minutes |
| Oakdale: | 5 minutes |
| Richfield: | 4 minutes |
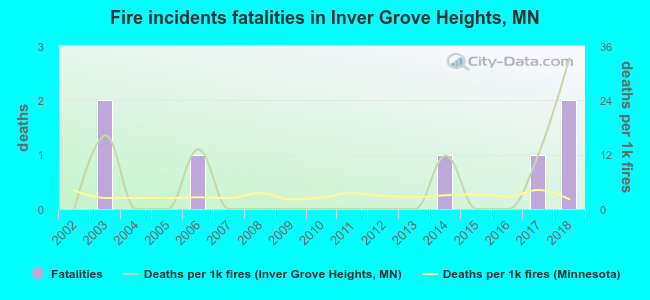 According to the reports from the years 2002 - 2018 the average number of fire-related yearly deaths is 0. The highest number of reported deaths - 2 took place in 2003, and the lowest - 0 in 2002. The data has a rising trend.
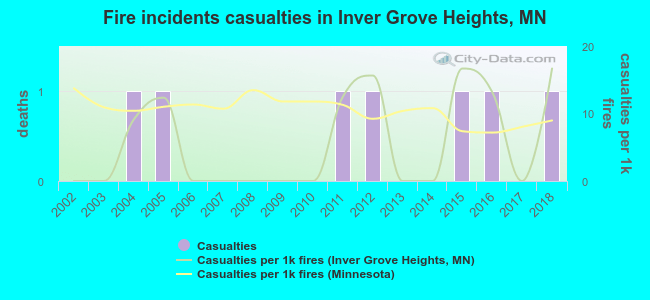 Based on the reports from the years 2002 - 2018 the average number of fire-related yearly casualties is 0. The highest number of injuries - 1 took place in 2004, and the lowest - 0 in 2002. The data has a growing trend.
The average number of casualties per 1,000 fires is 6. This indicator was the highest - 17 in 2015, and the lowest 0 in 2002. The trend for injuries per 1,000 fires is growing. Compared to the Minnesota value the number of casualties per 1,000 fire incidents is much lower.
Based on the reports from the years 2002 - 2018 the average number of fire-related yearly casualties is 0. The highest number of injuries - 1 took place in 2004, and the lowest - 0 in 2002. The data has a growing trend.
The average number of casualties per 1,000 fires is 6. This indicator was the highest - 17 in 2015, and the lowest 0 in 2002. The trend for injuries per 1,000 fires is growing. Compared to the Minnesota value the number of casualties per 1,000 fire incidents is much lower.Casualties per 1,000 incidents in Inver Grove Heights, MN compared to nearest cities:
(Note: Based on data for all years, including only cities with at least 500 fire incidents)
| Inver Grove Heights: | 5.1 |
| South St. Paul: | 3.8 |
| Cottage Grove: | 1.1 |
| Eagan: | 7.3 |
| Woodbury: | 12.2 |
| Apple Valley: | 18.8 |
| Maplewood: | 5.2 |
| Oakdale: | 11.8 |
| Richfield: | 20.5 |
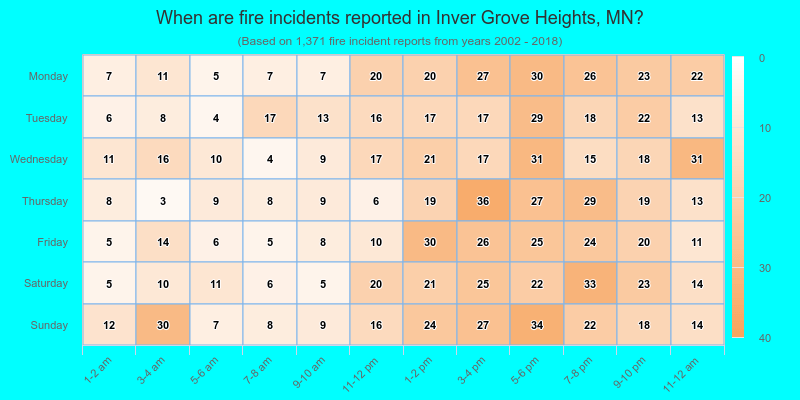
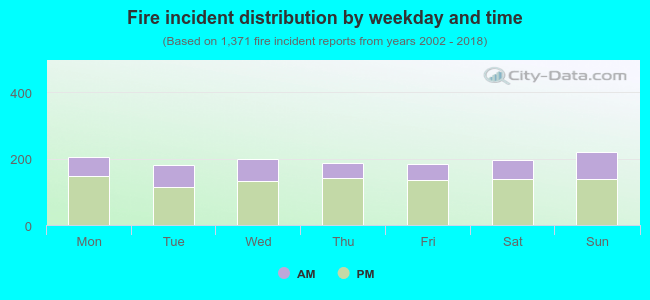 30.5% incidents where reported in the morning and 69.5% in the evening. The most fires (16.1%) took place on Sunday, and the least (13.1%) on Tuesday.
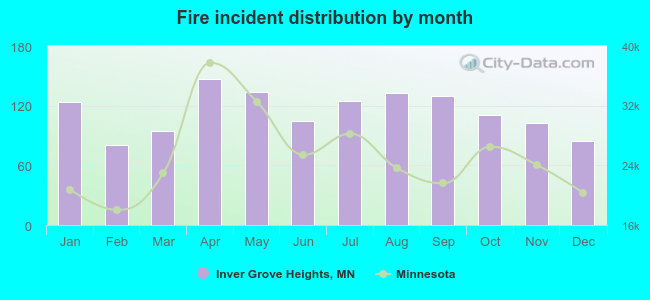 Based on the 1,371 incident reports from years 2002 - 2018 most fires (10.7%) took place during April, and the least (5.8%) in February.
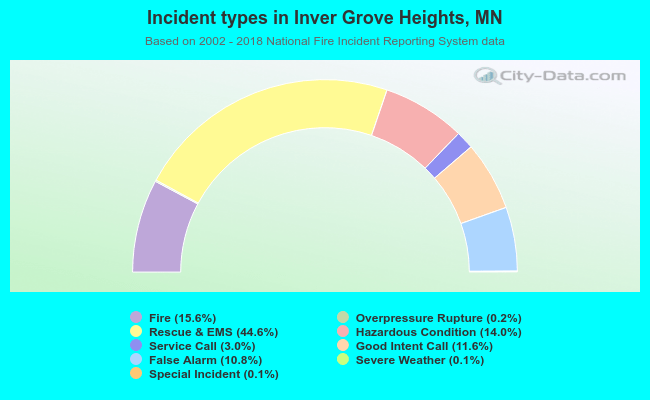 Out of all 8,769 cases reported during the years 2002 - 2018, the most belonged to the categories: Rescue & EMS (44.6%), Fire (15.6%), and Hazardous Condition (14.0%).
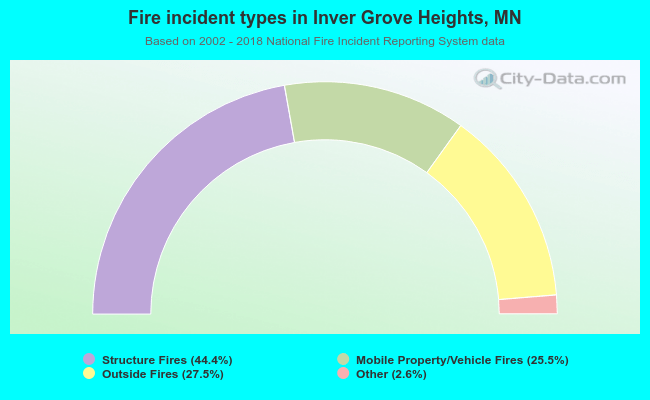 When looking into fire subcategories, the most reports belonged to: Structure Fires (44.4%), and Outside Fires (27.5%).