Cottage Grove: Fire Incidents, Minnesota (MN)
Where are fire incidents reported in Cottage Grove, MN
Something went wrong! Please refresh the page.
| Fire incidents reported | |
|---|---|
| Sreet name | Count |
| HIGHWAY 61 | 118 |
| E POINT DOUGLAS | 82 |
| 80TH ST | 62 |
| INDIAN BLVD | 60 |
| HINTON AVE | 50 |
| IDEAL AVE | 50 |
| HADLEY AVE | 48 |
| HAMLET AVE | 44 |
| 70TH ST | 40 |
| W POINT DOUGLAS | 36 |
| HARKNESS AVE | 34 |
| HEARTHSIDE AVE | 32 |
| 75TH ST | 30 |
| HILLSIDE TRL | 30 |
| 90TH ST | 28 |
| E POINT DOUGLAS RD | 26 |
| JAMAICA AVE | 26 |
| KIMBRO AVE | 26 |
| HYDE AVE | 24 |
| 100TH ST | 22 |
| LAMAR AVE | 22 |
| GREY CLOUD TRL | 20 |
| INNOVATION RD | 20 |
| JEFFERY AVE | 20 |
| JENSEN AVE | 20 |
| 77TH ST | 18 |
| HEMINGWAY AVE | 18 |
| HOMESTEAD AVE | 16 |
| IRONWOOD AVE | 16 |
| IVERSON AVE | 16 |
2002 - 2018 National Fire Incident Reporting System (NFIRS) incidents
- Incident types reported to NFIRS in Cottage Grove, MN
- 8,57369.5%Rescue & EMS
- 1,23010.0%Good Intent Call
- 1,0338.4%Hazardous Condition
- 9417.6%Fire
- 4743.8%False Alarm
- 700.6%Service Call
- Fire incident types reported to NFIRS in Cottage Grove, MN
- 41143.7%Structure Fires
- 33535.6%Outside Fires
- 16217.2%Mobile Property/Vehicle Fires
- 333.5%Other
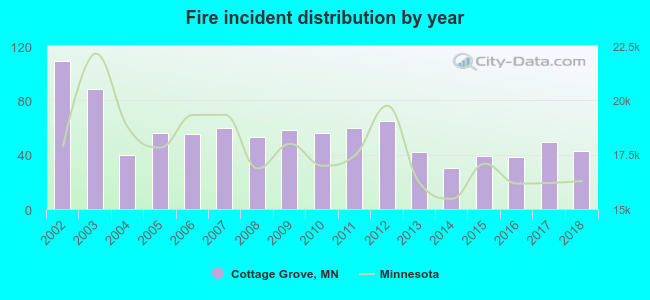 According to the data from the years 2002 - 2018 the average number of fires per year is 55. The highest number of reported fire incidents - 109 took place in 2002, and the least - 30 in 2014. The data has a declining trend.
The average number of yearly fire incidents per 10k residents in Cottage Grove, MN compared to nearest cities:
(Note: Based on data for the last 3 years, including only cities with population 5,000 and above)
| Cottage Grove: | 12.2 |
| Inver Grove Heights: | 20.9 |
| Woodbury: | 7.7 |
| Hastings: | 30.7 |
| Mendota Heights: | 15.1 |
| Rosemount: | 14.5 |
| Oakdale: | 18.4 |
| Eagan: | 12.1 |
| Lake Elmo: | 38.5 |
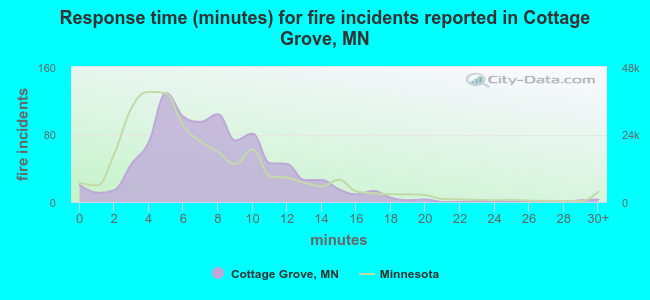 The median response time based on all reported fire incidents is 7 minutes. This is close to the state median value.
The median response time in Cottage Grove, MN compared to nearest cities:
(Note: Based on data for all years, including only cities with at least 500 fire incidents)
| Cottage Grove: | 7 minutes |
| Inver Grove Heights: | 7 minutes |
| Woodbury: | 6 minutes |
| South St. Paul: | 3 minutes |
| Hastings: | 6 minutes |
| Oakdale: | 5 minutes |
| Eagan: | 6 minutes |
| Lake Elmo: | 7 minutes |
| Maplewood: | 5 minutes |
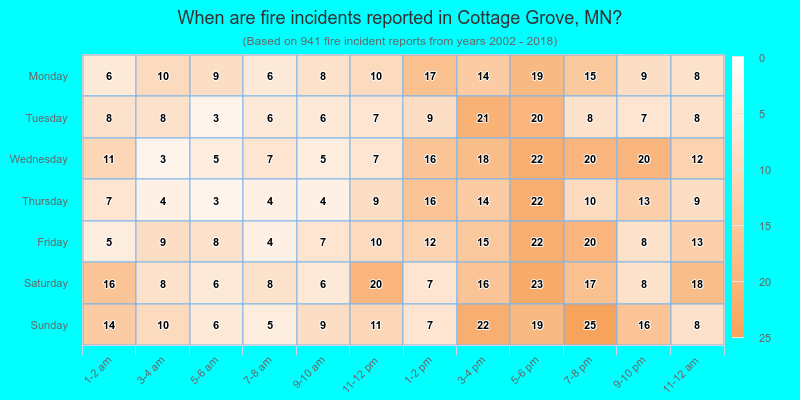
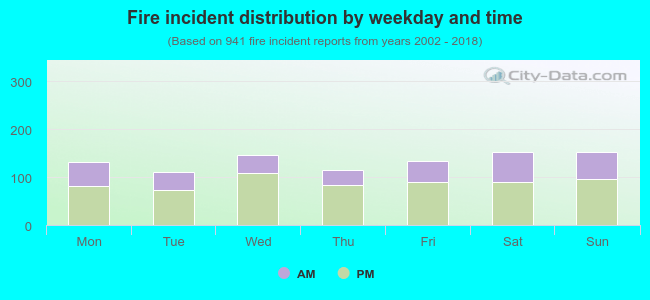 33.8% incidents where reported in the morning and 66.2% in the evening. The most fires (16.3%) took place on Saturday, and the least (11.8%) on Tuesday.
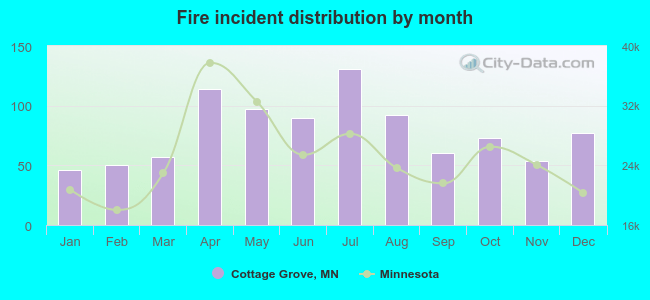 According to the 941 fires from years 2002 - 2018 most fires (13.9%) took place during July, and the least (4.9%) in January.
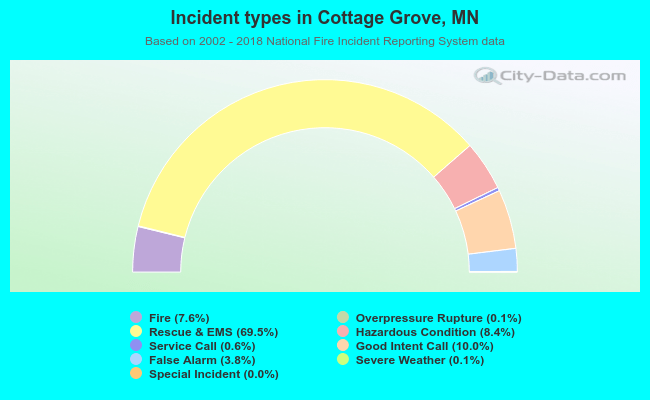 Out of all 12,339 cases reported during the years 2002 - 2018, the most belonged to the categories: Rescue & EMS (69.5%), Good Intent Call (10.0%), and Hazardous Condition (8.4%).
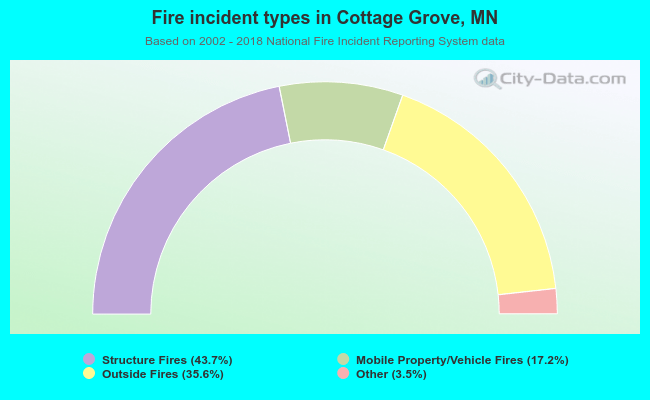 When looking into fire subcategories, the most reports belonged to: Structure Fires (43.7%), and Outside Fires (35.6%).