Northfield: Fire Incidents, Minnesota (MN)
Where are fire incidents reported in Northfield, MN
Something went wrong! Please refresh the page.
| Fire incidents reported | |
|---|---|
| Sreet name | Count |
| FOREST AVE | 108 |
| 5TH ST | 106 |
| HWY 3 | 106 |
| HWY 35 | 100 |
| DIVISION ST | 64 |
| GREENVALE AVE | 64 |
| ST OLAF AVE | 44 |
| 320TH ST | 34 |
| CANNON VALLEY DR | 34 |
| JEFFERSON PKY | 34 |
| JEFFERSON RD | 34 |
| KOESTER CT | 32 |
| 280TH ST | 28 |
| LONSDALE BLVD | 28 |
| WATER ST | 26 |
| SPRING ST | 24 |
| WOODLEY ST | 24 |
| 130TH ST | 22 |
| 3RD ST | 22 |
| WASHINGTON ST | 22 |
| 100TH ST | 20 |
| MAPLE ST | 20 |
| OAK ST | 20 |
| 2ND ST | 18 |
| 330TH ST | 18 |
| CANNON VALLEY PL | 18 |
| ENSLEY AVE | 18 |
| MILLERSBURG BLVD | 18 |
| 140TH ST | 16 |
| 295TH ST | 16 |
2002 - 2018 National Fire Incident Reporting System (NFIRS) incidents
- Incident types reported to NFIRS in Northfield, MN
- 1,09340.9%Fire
- 71326.7%Hazardous Condition
- 41715.6%Good Intent Call
- 38614.4%False Alarm
- 391.5%Service Call
- 170.6%Rescue & EMS
- 50.2%Overpressure Rupture
- 40.1%Severe Weather
- Fire incident types reported to NFIRS in Northfield, MN
- 50346.0%Structure Fires
- 36933.8%Outside Fires
- 21619.8%Mobile Property/Vehicle Fires
- 50.5%Other
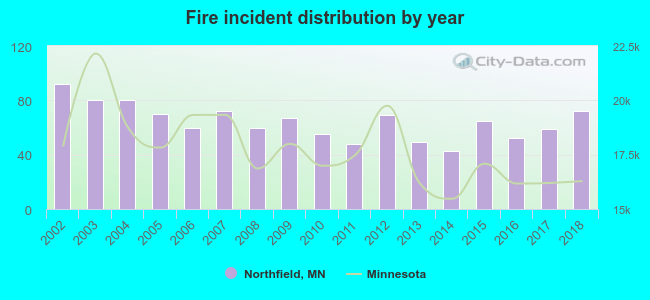 According to the data from the years 2002 - 2018 the average number of fire incidents per year is 64. The highest number of fires - 92 took place in 2002, and the least - 43 in 2014. The data has a dropping trend.
The average number of yearly fire incidents per 10k residents in Northfield, MN compared to nearest cities:
(Note: Based on data for the last 3 years, including only cities with population 5,000 and above)
| Northfield: | 30.0 |
| Faribault: | 43.5 |
| Farmington: | 18.0 |
| Lakeville: | 13.6 |
| Rosemount: | 14.5 |
| Apple Valley: | 16.2 |
| New Prague: | 34.0 |
| Burnsville: | 19.6 |
| Savage: | 9.7 |
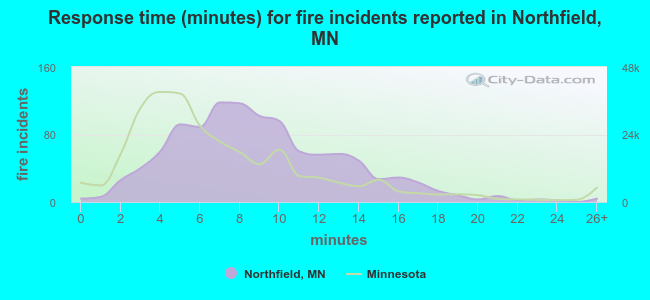 The median response time based on all reported fire incidents is 8 minutes. This is higher than the state median value.
The median response time in Northfield, MN compared to nearest cities:
(Note: Based on data for all years, including only cities with at least 500 fire incidents)
| Northfield: | 8 minutes |
| Faribault: | 6 minutes |
| Farmington: | 6 minutes |
| Lakeville: | 7 minutes |
| Apple Valley: | 5 minutes |
| Burnsville: | 6 minutes |
| Savage: | 5 minutes |
| Prior Lake: | 4 minutes |
| Hastings: | 6 minutes |
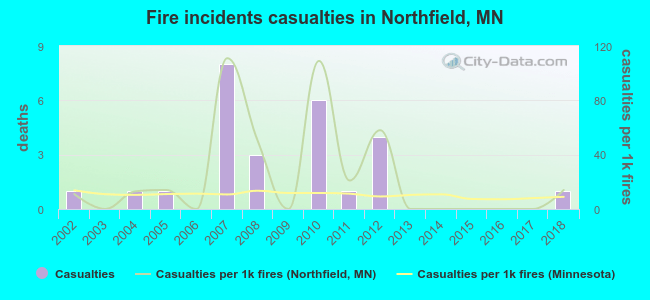 According to the data from the years 2002 - 2018 the average number of fire-related casualties per year is 2. The highest number of casualties - 8 took place in 2007, and the lowest - 0 in 2003. The data has a constant trend.
The average number of casualties per 1,000 fire incidents is 24. This indicator was the highest - 111 in 2007, and the lowest 0 in 2003. The trend for casualties per 1,000 fire incidents is rising. Compared to the Minnesota value the number of injuries per 1,000 incidents is much higher.
According to the data from the years 2002 - 2018 the average number of fire-related casualties per year is 2. The highest number of casualties - 8 took place in 2007, and the lowest - 0 in 2003. The data has a constant trend.
The average number of casualties per 1,000 fire incidents is 24. This indicator was the highest - 111 in 2007, and the lowest 0 in 2003. The trend for casualties per 1,000 fire incidents is rising. Compared to the Minnesota value the number of injuries per 1,000 incidents is much higher.Casualties per 1,000 incidents in Northfield, MN compared to nearest cities:
(Note: Based on data for all years, including only cities with at least 500 fire incidents)
| Northfield: | 23.8 |
| Faribault: | 0.6 |
| Farmington: | 7.8 |
| Lakeville: | 10.2 |
| Apple Valley: | 18.8 |
| Burnsville: | 33.4 |
| Savage: | 11.5 |
| Prior Lake: | 1.9 |
| Hastings: | 10.6 |
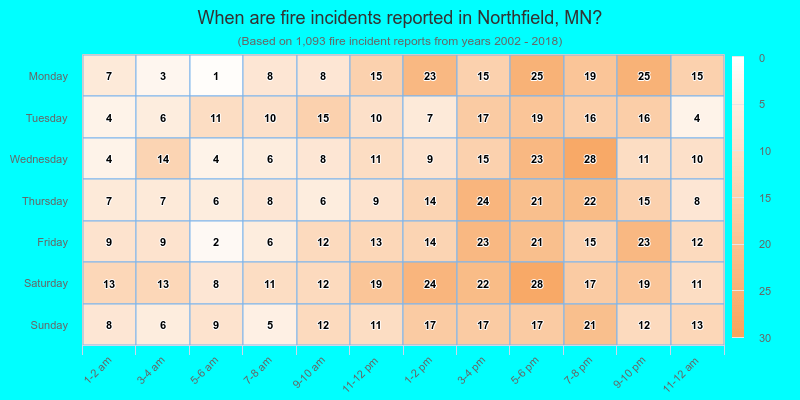
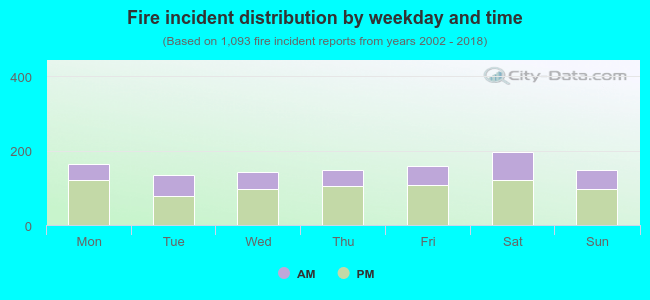 33.5% incidents where reported in the morning and 66.5% in the evening. The most fires (18.0%) took place on Saturday, and the least (12.4%) on Tuesday.
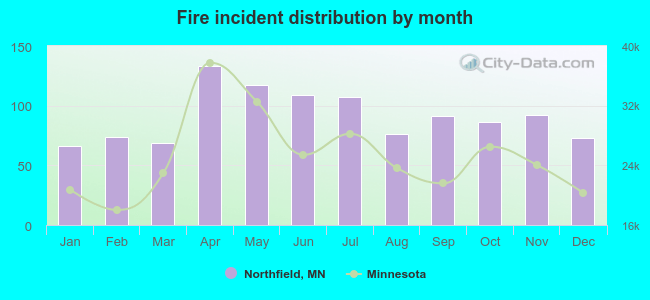 According to the 1,093 incident reports from years 2002 - 2018 most fires (12.2%) took place during April, and the least (6.0%) in January.
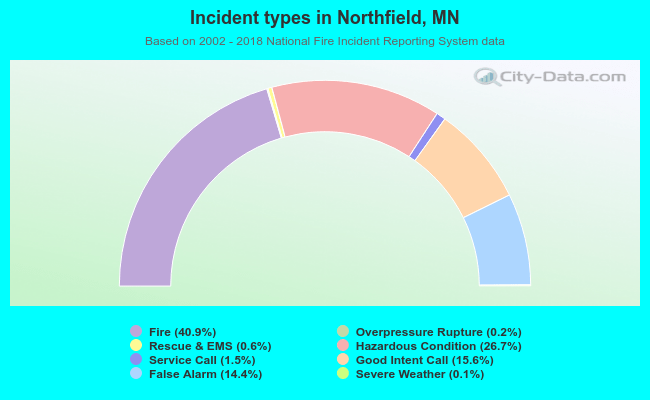 Out of all 2,674 cases reported during the years 2002 - 2018, the most belonged to the categories: Fire (40.9%), Hazardous Condition (26.7%), and Good Intent Call (15.6%).
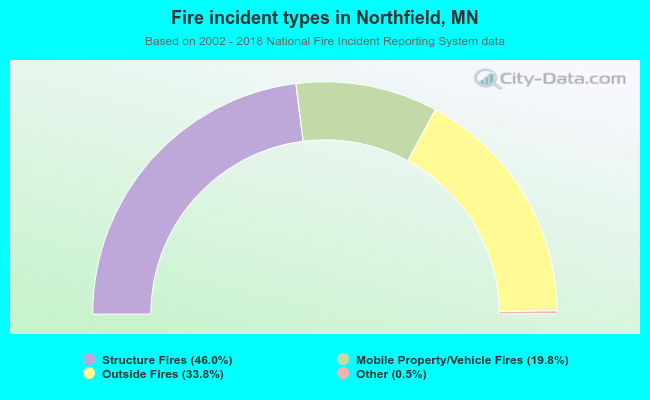 When looking into fire subcategories, the most reports belonged to: Structure Fires (46.0%), and Outside Fires (33.8%).