Savage: Fire Incidents, Minnesota (MN)
Where are fire incidents reported in Savage, MN
Something went wrong! Please refresh the page.
| Fire incidents reported | |
|---|---|
| Sreet name | Count |
| EGAN DR | 64 |
| HIGHWAY 13 | 56 |
| HWY 13 | 42 |
| MCCOLL DR | 32 |
| YOSEMITE AVE | 32 |
| GLENHURST AVE | 30 |
| 125TH ST | 28 |
| 126 ST | 24 |
| JOPPA AVE | 24 |
| NATCHEZ AVE | 24 |
| DAKOTA AVE | 20 |
| INGLEWOOD AVE | 20 |
| 126TH ST | 18 |
| HWY 101 | 18 |
| LYNN AVE | 18 |
| 125 ST | 16 |
| 150 ST | 16 |
| 150TH ST | 16 |
| ALABAMA AVE | 16 |
| GLENDALE RD | 16 |
| O'CONNELL RD | 16 |
| SOUTH PARK DR | 16 |
| 124TH ST | 14 |
| 140TH ST | 14 |
| BOONE AVE | 14 |
| EAGLE CREEK PKY | 14 |
| MONTEREY AVE | 14 |
| VERNON AVE | 14 |
| WYOMING AVE | 14 |
| 137TH ST | 12 |
| Other | 26 |
2002 - 2018 National Fire Incident Reporting System (NFIRS) incidents
- Incident types reported to NFIRS in Savage, MN
- 73422.8%Hazardous Condition
- 69821.7%Fire
- 64019.9%Rescue & EMS
- 55617.3%False Alarm
- 34710.8%Good Intent Call
- 1795.6%Service Call
- 331.0%Overpressure Rupture
- 260.8%Severe Weather
- Fire incident types reported to NFIRS in Savage, MN
- 32746.8%Structure Fires
- 21630.9%Outside Fires
- 11516.5%Mobile Property/Vehicle Fires
- 405.7%Other
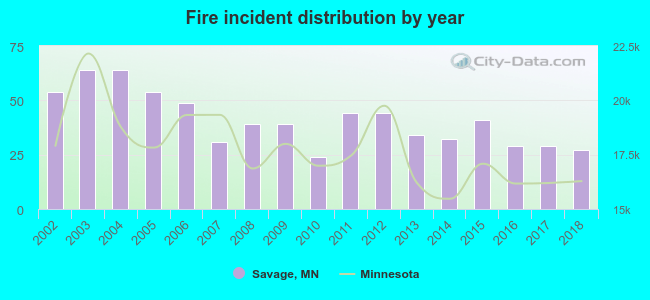 According to the data from the years 2002 - 2018 the average number of fire incidents per year is 41. The highest number of reported fires - 64 took place in 2003, and the least - 24 in 2010. The data has a dropping trend.
The average number of yearly fire incidents per 10k residents in Savage, MN compared to nearest cities:
(Note: Based on data for the last 3 years, including only cities with population 5,000 and above)
| Savage: | 9.7 |
| Burnsville: | 19.6 |
| Prior Lake: | 22.2 |
| Bloomington: | 21.2 |
| Lakeville: | 13.6 |
| Apple Valley: | 16.2 |
| Shakopee: | 24.1 |
| Eden Prairie: | 15.2 |
| Richfield: | 20.8 |
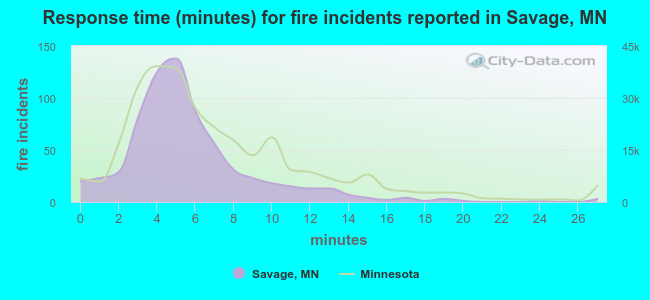 The median response time based on all reported fire incidents is 5 minutes. This is lower than the state median value.
The median response time in Savage, MN compared to nearest cities:
(Note: Based on data for all years, including only cities with at least 500 fire incidents)
| Savage: | 5 minutes |
| Burnsville: | 6 minutes |
| Prior Lake: | 4 minutes |
| Bloomington: | 5 minutes |
| Lakeville: | 7 minutes |
| Apple Valley: | 5 minutes |
| Shakopee: | 5 minutes |
| Eden Prairie: | 6 minutes |
| Richfield: | 4 minutes |
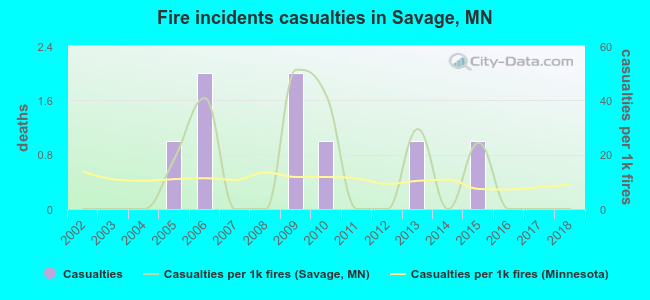 Based on the reports from the years 2002 - 2018 the average number of fire-related yearly casualties is 0. The highest number of injuries - 2 took place in 2006, and the lowest - 0 in 2002. The data has a constant trend.
The average number of injuries per 1,000 fires is 12. This indicator was the highest - 51 in 2009, and the lowest 0 in 2002. The trend for casualties per 1,000 fires is constant. Compared to the Minnesota value the number of injuries per 1,000 incidents is about the same.
Based on the reports from the years 2002 - 2018 the average number of fire-related yearly casualties is 0. The highest number of injuries - 2 took place in 2006, and the lowest - 0 in 2002. The data has a constant trend.
The average number of injuries per 1,000 fires is 12. This indicator was the highest - 51 in 2009, and the lowest 0 in 2002. The trend for casualties per 1,000 fires is constant. Compared to the Minnesota value the number of injuries per 1,000 incidents is about the same.Casualties per 1,000 incidents in Savage, MN compared to nearest cities:
(Note: Based on data for all years, including only cities with at least 500 fire incidents)
| Savage: | 11.5 |
| Burnsville: | 33.4 |
| Prior Lake: | 1.9 |
| Bloomington: | 10.0 |
| Lakeville: | 10.2 |
| Apple Valley: | 18.8 |
| Shakopee: | 13.2 |
| Eden Prairie: | 22.6 |
| Richfield: | 20.5 |
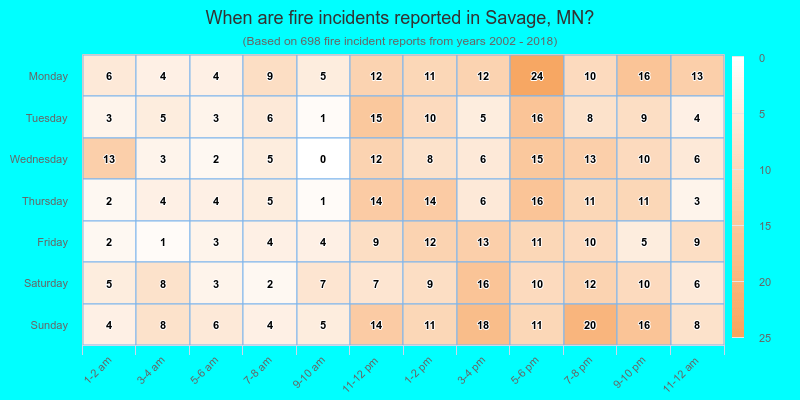
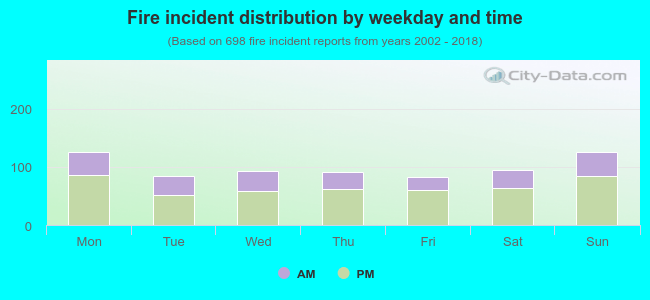 33.5% incidents where reported in the morning and 66.5% in the evening. The most fires (18.1%) took place on Monday, and the least (11.9%) on Friday.
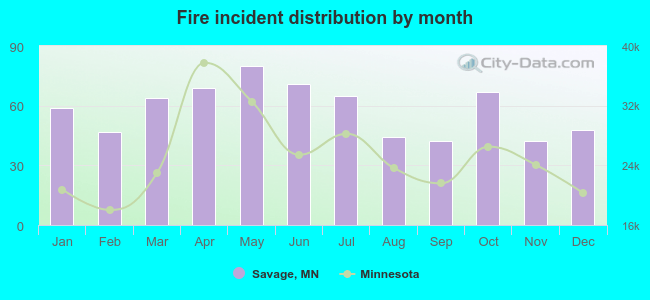 Based on the 698 incident reports from years 2002 - 2018 most fires (11.5%) took place during May, and the least (6.0%) in September.
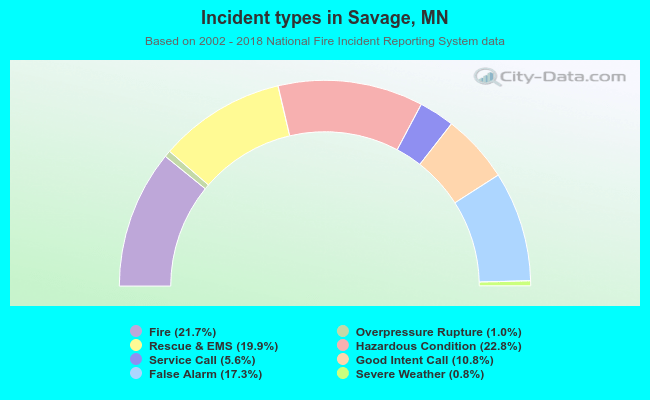 Out of all 3,213 cases reported during the years 2002 - 2018, the most belonged to the categories: Hazardous Condition (22.8%), Fire (21.7%), and Rescue & EMS (19.9%).
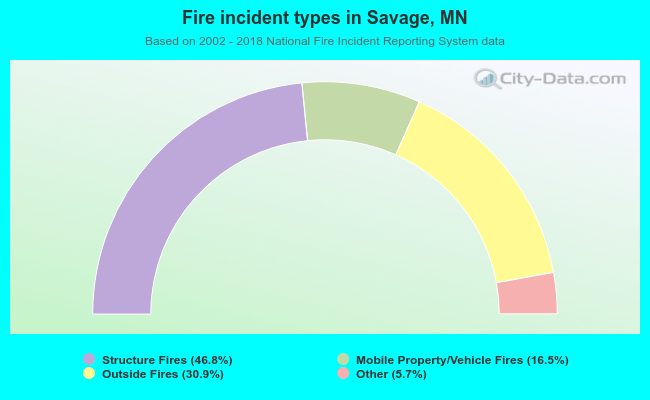 When looking into fire subcategories, the most reports belonged to: Structure Fires (46.8%), and Outside Fires (30.9%).