Milford: Fire Incidents, Massachusetts (MA)
Where are fire incidents reported in Milford, MA
Something went wrong! Please refresh the page.
| Fire incidents reported | |
|---|---|
| Sreet name | Count |
| CEDAR ST | 256 |
| MAIN ST | 190 |
| MEDWAY RD | 150 |
| FORTUNE BLVD | 130 |
| DILLA ST | 126 |
| E MAIN ST | 110 |
| WEST ST | 98 |
| PURCHASE ST | 92 |
| WATER ST | 88 |
| BEAVER ST | 80 |
| S MAIN ST | 78 |
| PROSPECT ST | 76 |
| CONGRESS ST | 68 |
| CENTRAL ST | 56 |
| EAST MAIN ST | 52 |
| COLONIAL RD | 48 |
| EBEN ST | 48 |
| HAVEN ST | 46 |
| PHEASANT CIR | 42 |
| SUMNER ST | 42 |
| 495 NB | 34 |
| JEFFERSON ST | 34 |
| SOUTH MAIN ST | 34 |
| CAPITOL RD | 32 |
| SPRING ST | 32 |
| DOMINICK ST | 30 |
| HIGHLAND ST | 30 |
| LINCOLN ST | 30 |
| MT PLEASANT ST | 30 |
| SCHOOL ST | 30 |
| Other | 90 |
2002 - 2018 National Fire Incident Reporting System (NFIRS) incidents
- Incident types reported to NFIRS in Milford, MA
- 18,21158.7%Rescue & EMS
- 3,73912.0%Service Call
- 2,9069.4%Hazardous Condition
- 2,5338.2%False Alarm
- 2,2827.4%Fire
- 1,2253.9%Good Intent Call
- 1030.3%Special Incident
- Fire incident types reported to NFIRS in Milford, MA
- 1,11748.9%Structure Fires
- 82536.2%Outside Fires
- 30513.4%Mobile Property/Vehicle Fires
- 351.5%Other
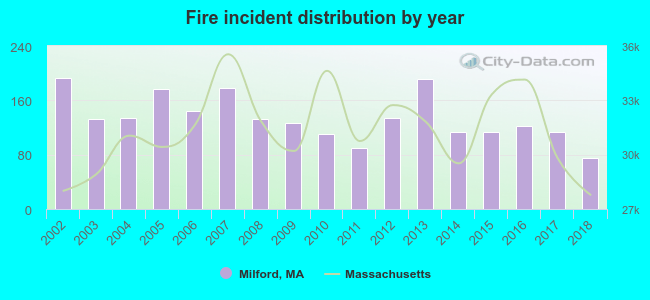 Based on the data from the years 2002 - 2018 the average number of fires per year is 134. The highest number of fires - 193 took place in 2002, and the least - 75 in 2018. The data has a decreasing trend.
The average number of yearly fire incidents per 10k residents in Milford, MA compared to nearest cities:
(Note: Based on data for the last 3 years, including only cities with population 5,000 and above)
| Milford: | 41.4 |
| Mendon: | 15.4 |
| Medway: | 42.1 |
| Upton: | 33.6 |
| Holliston: | 5.2 |
| Franklin: | 22.5 |
| Northbridge: | 32.5 |
| Uxbridge: | 36.2 |
| Blackstone: | 17.7 |
 The median response time based on all reported fire incidents is 5 minutes. This is higher than the state median value.
The median response time in Milford, MA compared to nearest cities:
(Note: Based on data for all years, including only cities with at least 500 fire incidents)
| Milford: | 5 minutes |
| Bellingham: | 7 minutes |
| Upton: | 5 minutes |
| Hopkinton: | 6 minutes |
| Franklin: | 6 minutes |
| Northbridge: | 7 minutes |
| Uxbridge: | 7 minutes |
| Blackstone: | 5 minutes |
| Westborough: | 5 minutes |
 According to the data from the years 2002 - 2018 the average number of fire-related yearly casualties is 3. The highest number of casualties - 10 took place in 2010, and the lowest - 0 in 2015. The data has a growing trend.
The average number of casualties per 1,000 fires is 27. This indicator was the highest - 90 in 2010, and the lowest 0 in 2015. The trend for injuries per 1,000 fire incidents is growing. Compared to the Massachusetts value the number of casualties per 1,000 fire incidents is much higher.
According to the data from the years 2002 - 2018 the average number of fire-related yearly casualties is 3. The highest number of casualties - 10 took place in 2010, and the lowest - 0 in 2015. The data has a growing trend.
The average number of casualties per 1,000 fires is 27. This indicator was the highest - 90 in 2010, and the lowest 0 in 2015. The trend for injuries per 1,000 fire incidents is growing. Compared to the Massachusetts value the number of casualties per 1,000 fire incidents is much higher.Casualties per 1,000 incidents in Milford, MA compared to nearest cities:
(Note: Based on data for all years, including only cities with at least 500 fire incidents)
| Milford: | 25.0 |
| Bellingham: | 12.0 |
| Upton: | 1.6 |
| Hopkinton: | 8.7 |
| Franklin: | 3.0 |
| Northbridge: | 20.6 |
| Uxbridge: | 24.6 |
| Blackstone: | 15.5 |
| Westborough: | 10.5 |
 32.1% incidents where reported in the morning and 67.9% in the evening. The most fires (15.7%) took place on Monday, and the least (12.9%) on Wednesday.
 Based on the 2,282 fires from years 2002 - 2018 most fires (13.2%) took place during April, and the least (5.8%) in December.
 Out of all 31,033 cases reported during the years 2002 - 2018, the most belonged to the categories: Rescue & EMS (58.7%), Service Call (12.0%), and Hazardous Condition (9.4%).
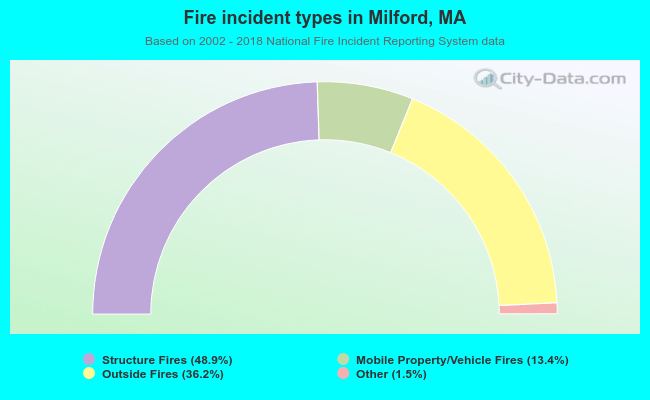 When looking into fire subcategories, the most reports belonged to: Structure Fires (48.9%), and Outside Fires (36.2%).