Mendon: Fire Incidents, Massachusetts (MA)
Where are fire incidents reported in Mendon, MA
Something went wrong! Please refresh the page.
|
| |||||||||||||||||||||||||||||||||||||||||||||||||||||||||||||||||||||||||||||||||||||||||||||||||||||||||||||
2002 - 2018 National Fire Incident Reporting System (NFIRS) incidents
- Incident types reported to NFIRS in Mendon, MA
- 2,37255.6%Rescue & EMS
- 58813.8%Hazardous Condition
- 3929.2%False Alarm
- 3628.5%Fire
- 2786.5%Service Call
- 2375.6%Good Intent Call
- 300.7%Special Incident
- Fire incident types reported to NFIRS in Mendon, MA
- 15342.3%Structure Fires
- 14941.2%Outside Fires
- 318.6%Other
- 298.0%Mobile Property/Vehicle Fires
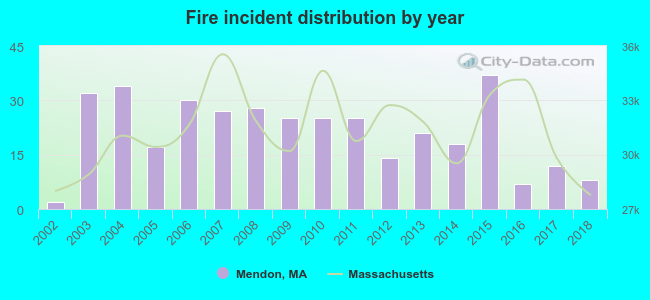 According to the data from the years 2002 - 2018 the average number of fires per year is 21. The highest number of reported fire incidents - 37 took place in 2015, and the least - 2 in 2002. The data has a growing trend.
The average number of yearly fire incidents per 10k residents in Mendon, MA compared to nearest cities:
(Note: Based on data for the last 3 years, including only cities with population 5,000 and above)
| Mendon: | 15.4 |
| Milford: | 41.4 |
| Blackstone: | 17.7 |
| Uxbridge: | 36.2 |
| Northbridge: | 32.5 |
| Upton: | 33.6 |
| Whitinsville: | 3.0 |
| Franklin: | 22.5 |
| Medway: | 42.1 |

 27.3% incidents where reported in the morning and 72.7% in the evening. The most fires (17.7%) took place on Friday, and the least (12.4%) on Tuesday.
 According to the 362 fires from years 2002 - 2018 most fires (19.1%) took place during April, and the least (2.8%) in September.
 Out of all 4,265 cases reported during the years 2002 - 2018, the most belonged to the categories: Rescue & EMS (55.6%), Hazardous Condition (13.8%), and False Alarm (9.2%).
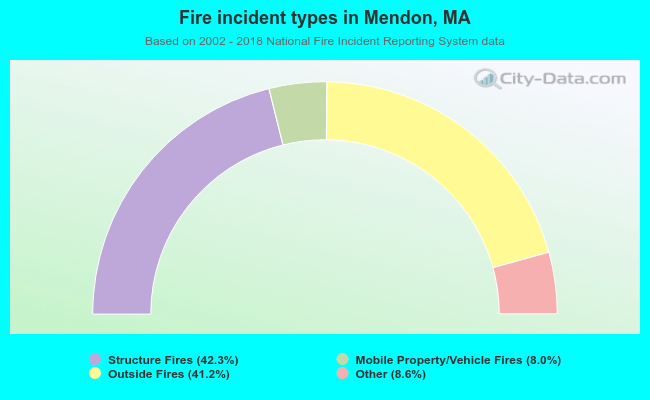 When looking into fire subcategories, the most incidents belonged to: Structure Fires (42.3%), and Outside Fires (41.2%).