Blackstone: Fire Incidents, Massachusetts (MA)
Where are fire incidents reported in Blackstone, MA
Something went wrong! Please refresh the page.
| Fire incidents reported | |
|---|---|
| Sreet name | Count |
| MAIN ST | 98 |
| ELM ST | 74 |
| MENDON ST | 70 |
| FARM ST | 62 |
| BLACKSTONE ST | 46 |
| RAYNER ST | 42 |
| RATHBUN ST | 40 |
| LINCOLN ST | 32 |
| FEDERAL ST | 28 |
| CANAL ST | 26 |
| CHESTNUT ST | 26 |
| EDGEWATER DR | 24 |
| BELLINGHAM RD | 22 |
| CARTER AVE | 22 |
| SUMMER ST | 22 |
| MILK ST | 20 |
| ORCHARD ST | 20 |
| FOX BROOK MNR | 18 |
| BRIDGE ST | 16 |
| LAKESHORE DR | 16 |
| WARNER ST | 16 |
| CHAMPLAIN AVE | 14 |
| ROCCO DR | 14 |
| ST PAUL ST | 12 |
| UNION ST | 12 |
| ASCENSION ST | 10 |
| AUSTIN ST | 10 |
| LAKEVIEW ST | 10 |
| LIBERTY HILL DR | 10 |
| MILL ST | 10 |
2002 - 2018 National Fire Incident Reporting System (NFIRS) incidents
- Incident types reported to NFIRS in Blackstone, MA
- 82226.0%Rescue & EMS
- 72422.9%False Alarm
- 57918.3%Fire
- 56617.9%Hazardous Condition
- 2668.4%Service Call
- 1795.7%Good Intent Call
- 140.4%Special Incident
- 80.3%Overpressure Rupture
- Fire incident types reported to NFIRS in Blackstone, MA
- 26645.9%Outside Fires
- 22639.0%Structure Fires
- 478.1%Other
- 406.9%Mobile Property/Vehicle Fires
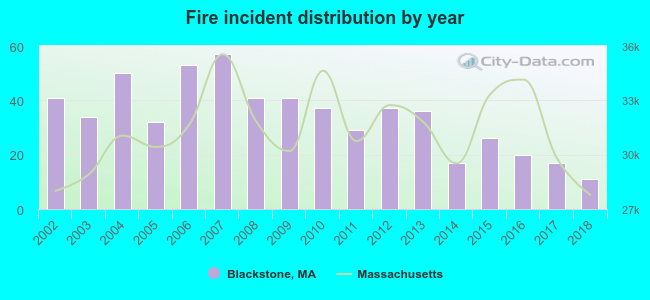 According to the data from the years 2002 - 2018 the average number of fires per year is 34. The highest number of reported fire incidents - 57 took place in 2007, and the least - 11 in 2018. The data has a declining trend.
The average number of yearly fire incidents per 10k residents in Blackstone, MA compared to nearest cities:
(Note: Based on data for the last 3 years, including only cities with population 5,000 and above)
| Blackstone: | 17.7 |
| Mendon: | 15.4 |
| Uxbridge: | 36.2 |
| Franklin: | 22.5 |
| Milford: | 41.4 |
| Northbridge: | 32.5 |
| Whitinsville: | 3.0 |
| Wrentham: | 20.1 |
| Medway: | 42.1 |
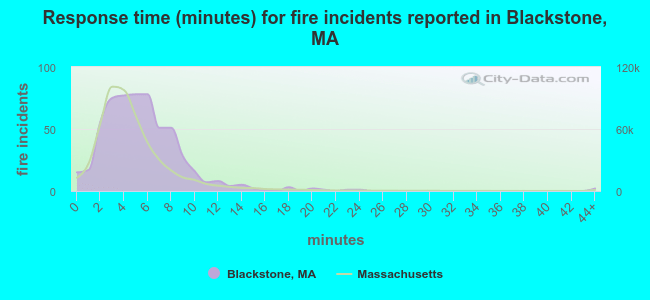 The median response time based on all reported fire incidents is 5 minutes. This is higher than the state median value.
The median response time in Blackstone, MA compared to nearest cities:
(Note: Based on data for all years, including only cities with at least 500 fire incidents)
| Blackstone: | 5 minutes |
| Bellingham: | 7 minutes |
| Uxbridge: | 7 minutes |
| Franklin: | 6 minutes |
| Milford: | 5 minutes |
| Northbridge: | 7 minutes |
| Wrentham: | 2 minutes |
| Douglas: | 8 minutes |
| Plainville: | 4 minutes |
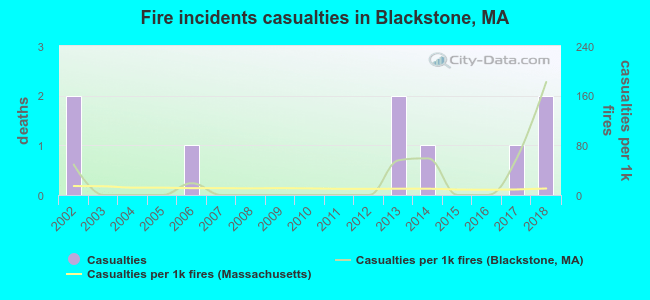 Based on the reports from the years 2002 - 2018 the average number of fire-related yearly casualties is 1. The highest number of casualties - 2 took place in 2002, and the lowest - 0 in 2003. The data has a constant trend.
The average number of casualties per 1,000 fire incidents is 25. This indicator was the highest - 182 in 2018, and the lowest 0 in 2003. The trend for injuries per 1,000 fires is increasing. Compared to the Massachusetts value the number of injuries per 1,000 fires is higher.
Based on the reports from the years 2002 - 2018 the average number of fire-related yearly casualties is 1. The highest number of casualties - 2 took place in 2002, and the lowest - 0 in 2003. The data has a constant trend.
The average number of casualties per 1,000 fire incidents is 25. This indicator was the highest - 182 in 2018, and the lowest 0 in 2003. The trend for injuries per 1,000 fires is increasing. Compared to the Massachusetts value the number of injuries per 1,000 fires is higher.Casualties per 1,000 incidents in Blackstone, MA compared to nearest cities:
(Note: Based on data for all years, including only cities with at least 500 fire incidents)
| Blackstone: | 15.5 |
| Bellingham: | 12.0 |
| Uxbridge: | 24.6 |
| Franklin: | 3.0 |
| Milford: | 25.0 |
| Northbridge: | 20.6 |
| Wrentham: | 0.0 |
| Douglas: | 7.6 |
| Plainville: | 7.6 |
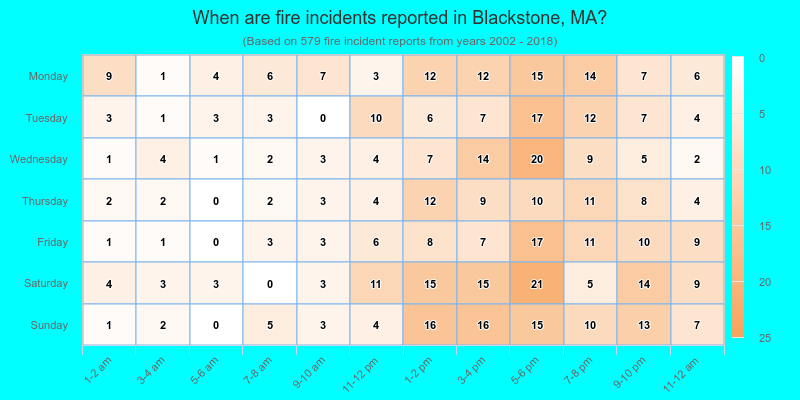
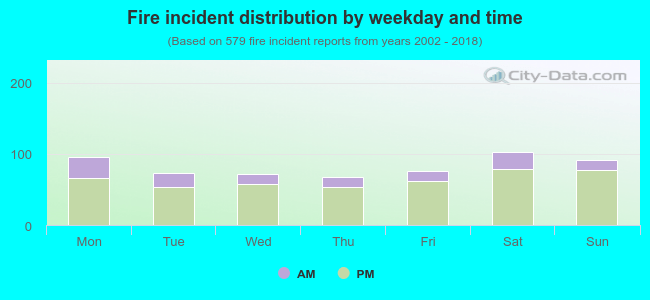 22.6% incidents where reported in the morning and 77.4% in the evening. The most fires (17.8%) took place on Saturday, and the least (11.6%) on Thursday.
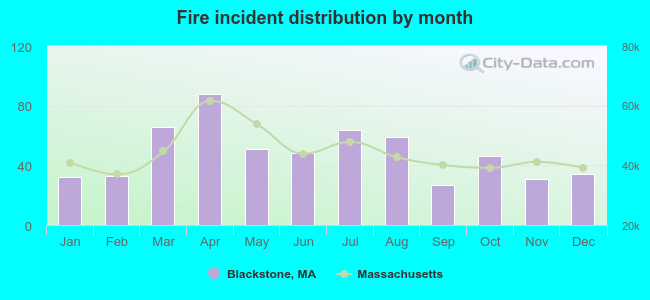 Based on the 579 fires from years 2002 - 2018 most fires (15.2%) took place during April, and the least (4.7%) in September.
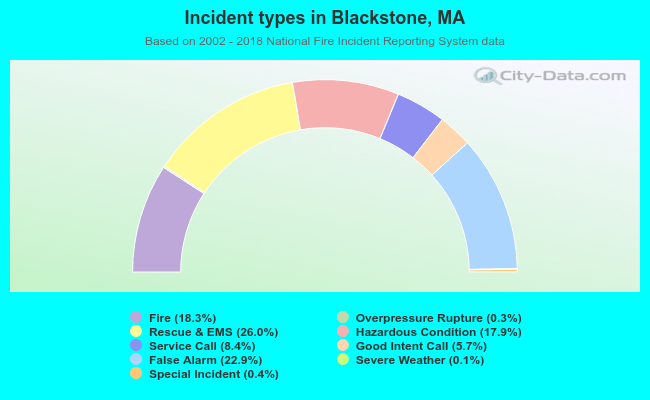 Out of all 3,161 cases reported during the years 2002 - 2018, the most belonged to the categories: Rescue & EMS (26.0%), False Alarm (22.9%), and Fire (18.3%).
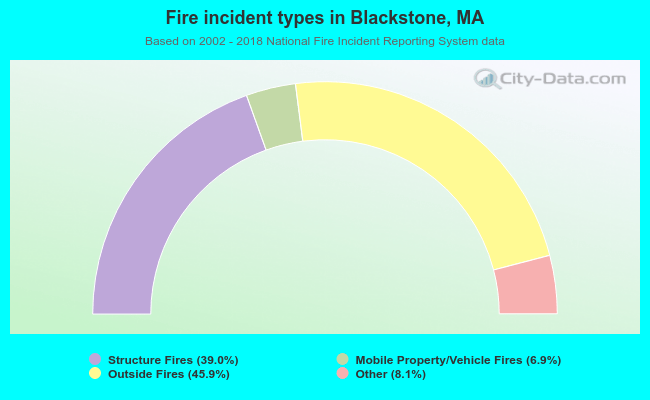 When looking into fire subcategories, the most incidents belonged to: Outside Fires (45.9%), and Structure Fires (39.0%).