Bellingham: Fire Incidents, Massachusetts (MA)
Where are fire incidents reported in Bellingham, MA
Something went wrong! Please refresh the page.
| Fire incidents reported | |
|---|---|
| Sreet name | Count |
| HARTFORD AVE | 128 |
| HARTFORD AVENUE | 98 |
| SOUTH MAIN ST | 74 |
| PULASKI BLVD | 72 |
| PULASKI BOULEVARD | 58 |
| 495 NORTHBOUND | 56 |
| BLACKSTONE ST | 54 |
| NORTH MAIN ST | 52 |
| SOUTH MAIN STREET | 52 |
| BLACKSTONE STREET | 48 |
| MAPLE ST | 40 |
| FARM ST | 36 |
| MAPLE STREET | 36 |
| MECHANIC ST | 36 |
| 495 SOUTHBOUND | 30 |
| DEPOT STREET | 30 |
| DEPOT ST | 28 |
| NORTH MAIN STREET | 26 |
| MECHANIC STREET | 24 |
| WRENTHAM RD | 22 |
| CENTER STREET | 20 |
| FARM ST | 16 |
| LAKE ST | 16 |
| MENDON ST | 14 |
| PAINE ST | 14 |
| WRENTHAM STREET | 14 |
| FARM STREET | 12 |
| PINE ACRES DR | 12 |
| SILVER LAKE ROAD | 12 |
| DEPOT CT | 10 |
| Other | 23 |
2002 - 2018 National Fire Incident Reporting System (NFIRS) incidents
- Incident types reported to NFIRS in Bellingham, MA
- 6,86958.1%Rescue & EMS
- 1,22010.3%Service Call
- 1,1639.8%Fire
- 1,0498.9%Hazardous Condition
- 9077.7%False Alarm
- 5414.6%Good Intent Call
- 670.6%Special Incident
- Fire incident types reported to NFIRS in Bellingham, MA
- 57049.0%Structure Fires
- 38433.0%Outside Fires
- 16814.4%Mobile Property/Vehicle Fires
- 413.5%Other
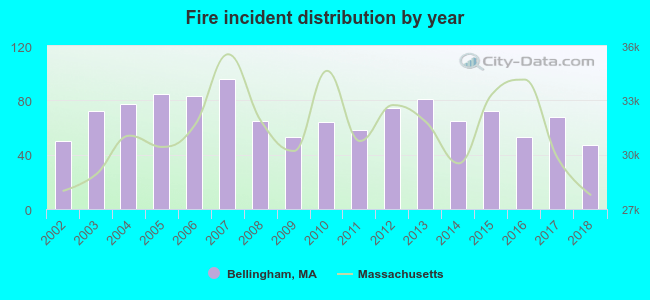 Based on the data from the years 2002 - 2018 the average number of fires per year is 68. The highest number of reported fire incidents - 96 took place in 2007, and the least - 47 in 2018. The data has a dropping trend.
 The median response time based on all reported fire incidents is 7 minutes. This is higher compared to the Massachusetts median value.
The median response time in Bellingham, MA compared to nearest cities:
(Note: Based on data for all years, including only cities with at least 500 fire incidents)
| Bellingham: | 7 minutes |
| Franklin: | 6 minutes |
| Milford: | 5 minutes |
| Blackstone: | 5 minutes |
| Wrentham: | 2 minutes |
| Norfolk: | 3 minutes |
| Uxbridge: | 7 minutes |
| Upton: | 5 minutes |
| Hopkinton: | 6 minutes |
 Based on the reports from the years 2002 - 2018 the average number of fire-related casualties per year is 1. The highest number of reported injuries - 3 took place in 2003, and the lowest - 0 in 2004. The data has a constant trend.
The average number of casualties per 1,000 fires is 13. This indicator was the highest - 42 in 2003, and the lowest 0 in 2004. The trend for injuries per 1,000 fires is growing. Compared to the state value the number of casualties per 1,000 incidents is similar.
Based on the reports from the years 2002 - 2018 the average number of fire-related casualties per year is 1. The highest number of reported injuries - 3 took place in 2003, and the lowest - 0 in 2004. The data has a constant trend.
The average number of casualties per 1,000 fires is 13. This indicator was the highest - 42 in 2003, and the lowest 0 in 2004. The trend for injuries per 1,000 fires is growing. Compared to the state value the number of casualties per 1,000 incidents is similar.
 31.9% incidents where reported in the morning and 68.1% in the evening. The most fires (15.1%) took place on Monday, and the least (13.1%) on Tuesday.
 Based on the 1,163 fires from years 2002 - 2018 most fires (14.2%) took place during April, and the least (6.4%) in January.
 Out of all 11,831 cases reported during the years 2002 - 2018, the most belonged to the categories: Rescue & EMS (58.1%), Service Call (10.3%), and Fire (9.8%).
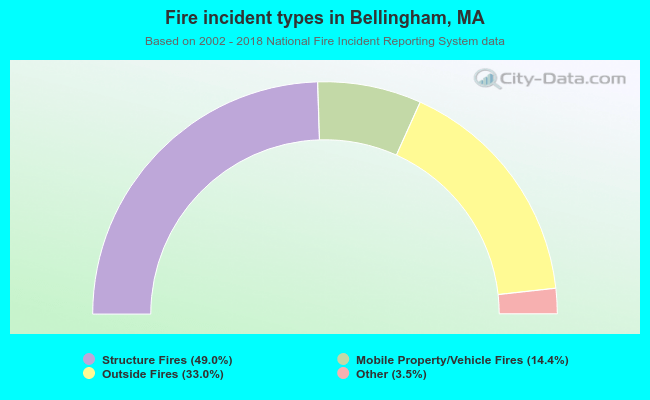 When looking into fire subcategories, the most incidents belonged to: Structure Fires (49.0%), and Outside Fires (33.0%).