Holliston: Fire Incidents, Massachusetts (MA)
Where are fire incidents reported in Holliston, MA
Something went wrong! Please refresh the page.
|
| |||||||||||||||||||||||||||||||||||||||||||||||||||||||||||||||||||||||||||||||||||||||||||||||||||||||||||||
2002 - 2018 National Fire Incident Reporting System (NFIRS) incidents
- Incident types reported to NFIRS in Holliston, MA
- 16753.5%Rescue & EMS
- 10834.6%Fire
- 319.9%Good Intent Call
- 41.3%Service Call
- 10.3%Hazardous Condition
- 10.3%Special Incident
- Fire incident types reported to NFIRS in Holliston, MA
- 8881.5%Structure Fires
- 1312.0%Mobile Property/Vehicle Fires
- 43.7%Outside Fires
- 32.8%Other
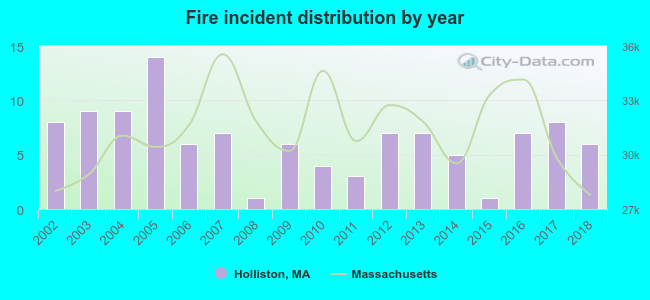 Based on the data from the years 2002 - 2018 the average number of fire incidents per year is 6. The highest number of reported fire incidents - 14 took place in 2005, and the least - 1 in 2008. The data has a declining trend.
The average number of yearly fire incidents per 10k residents in Holliston, MA compared to nearest cities:
(Note: Based on data for the last 3 years, including only cities with population 5,000 and above)
| Holliston: | 5.2 |
| Medway: | 42.1 |
| Millis: | 6.3 |
| Ashland: | 30.1 |
| Milford: | 41.4 |
| Medfield: | 29.8 |
| Framingham: | 89.7 |
| Franklin: | 22.5 |
| Natick: | 25.0 |
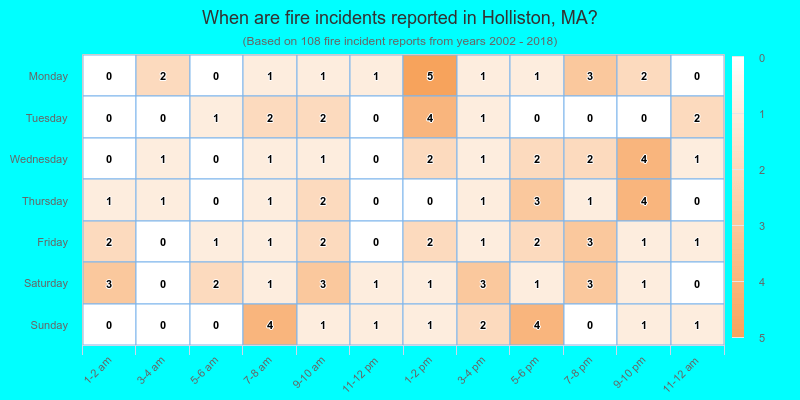
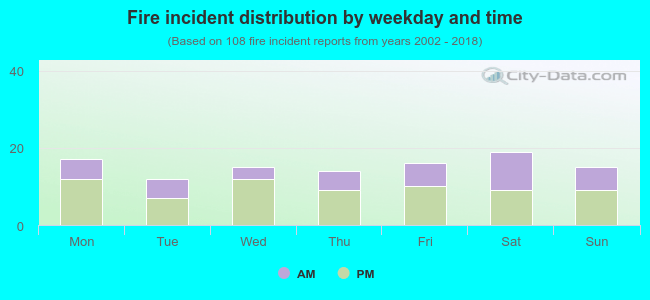 37.0% incidents where reported in the morning and 63.0% in the evening. The most fires (17.6%) took place on Saturday, and the least (11.1%) on Tuesday.
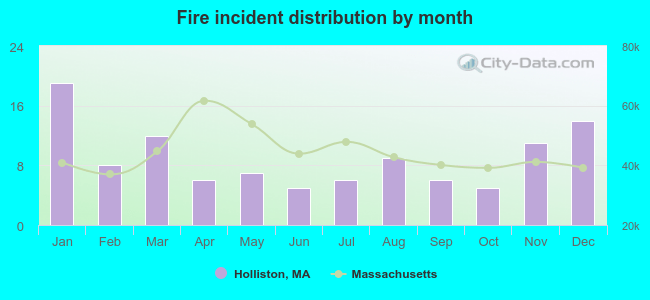 According to the 108 fire incident reports from years 2002 - 2018 most fires (17.6%) took place during January, and the least (4.6%) in June.
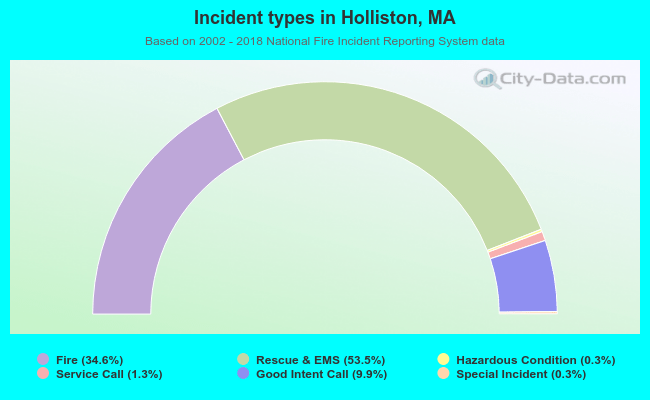 Out of all 312 cases reported during the years 2002 - 2018, the most belonged to the categories: Overpressure Rupture (53.5%), Fire (34.6%), and Service Call (9.9%).
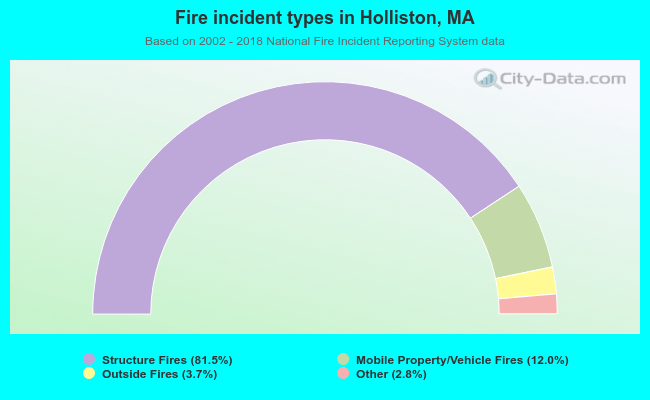 When looking into fire subcategories, the most reports belonged to: Structure Fires (81.5%), and Mobile Property/Vehicle Fires (12.0%).