Half Moon Bay: Fire Incidents, California (CA)
Where are fire incidents reported in Half Moon Bay, CA
Something went wrong! Please refresh the page.
|
| |||||||||||||||||||||||||||||||||||||||||||||||||||||||||||||||||||||||||||||||||||||||||||||||||||||||||||||
2005 - 2018 National Fire Incident Reporting System (NFIRS) incidents
- Incident types reported to NFIRS in Half Moon Bay, CA
- 18829.1%Hazardous Condition
- 17927.8%Fire
- 16725.9%Rescue & EMS
- 7211.2%Service Call
- 192.9%Good Intent Call
- 192.9%False Alarm
- 10.2%Special Incident
- Fire incident types reported to NFIRS in Half Moon Bay, CA
- 7240.2%Outside Fires
- 6838.0%Structure Fires
- 2212.3%Other
- 179.5%Mobile Property/Vehicle Fires
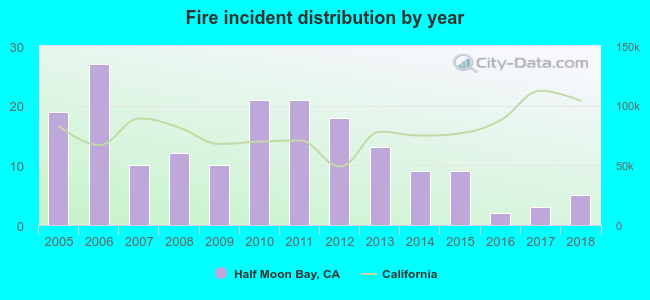 According to the data from the years 2005 - 2018 the average number of fires per year is 13. The highest number of fire incidents - 27 took place in 2006, and the least - 2 in 2016. The data has a decreasing trend.
The average number of yearly fire incidents per 10k residents in Half Moon Bay, CA compared to nearest cities:
(Note: Based on data for the last 3 years, including only cities with population 5,000 and above)
| Half Moon Bay: | 2.7 |
| El Granada: | 4.9 |
| Hillsborough: | 12.6 |
| Belmont: | 17.4 |
| San Mateo: | 14.1 |
| Burlingame: | 17.3 |
| San Carlos: | 15.2 |
| Millbrae: | 25.4 |
| Woodside: | 83.2 |

 Based on the reports from the years 2005 - 2018 the average number of fire-related yearly casualties is 0. The highest number of reported injuries - 1 took place in 2005, and the lowest - 0 in 2008. The data has a decreasing trend.
 35.2% incidents where reported in the morning and 64.8% in the evening. The most fires (17.3%) took place on Tuesday, and the least (10.6%) on Monday.
 Based on the 179 fires from years 2005 - 2018 most fires (11.7%) took place during October, and the least (5.0%) in December.
 Out of all 645 cases reported during the years 2005 - 2018, the most belonged to the categories: Rescue & EMS (29.1%), Fire (27.8%), and Overpressure Rupture (25.9%).
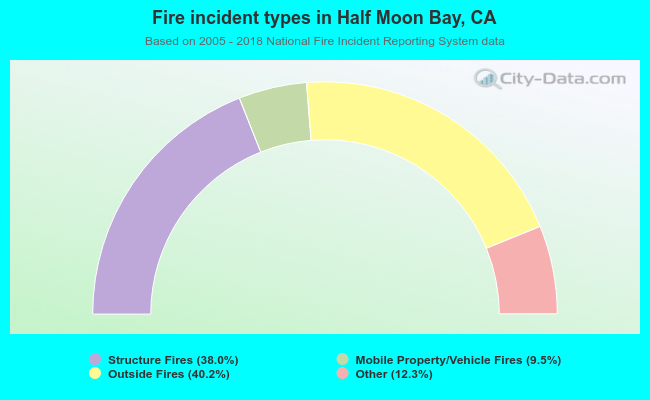 When looking into fire subcategories, the most incidents belonged to: Outside Fires (40.2%), and Structure Fires (38.0%).