Deerfield Beach: Fire Incidents, Florida (FL)
Where are fire incidents reported in Deerfield Beach, FL
Something went wrong! Please refresh the page.
| Fire incidents reported | |
|---|---|
| Sreet name | Count |
| HILLSBORO BLVD | 190 |
| POWERLINE RD | 116 |
| I95 | 88 |
| FEDERAL HWY | 78 |
| SAMPLE RD | 74 |
| DIXIE HWY | 70 |
| 3RD AVE | 56 |
| 9TH AVE | 50 |
| MILITARY TRL | 50 |
| 15TH ST | 46 |
| 1ST TER | 46 |
| 48TH ST | 46 |
| 10TH ST | 44 |
| 2ND ST | 44 |
| 2ND AVE | 42 |
| CRYSTAL LAKE DR | 42 |
| 6TH AVE | 36 |
| OCEAN DR | 32 |
| LOCK RD | 30 |
| 11TH WAY | 28 |
| 8TH AVE | 26 |
| 1ST WAY | 24 |
| DEER CREEK JEFFERSON DR | 24 |
| 3RD ST | 20 |
| 4TH AVE | 20 |
| 4TH ST | 20 |
| 12TH AVE | 18 |
| 3RD CT | 18 |
| 42ND CT | 18 |
| 44TH ST | 18 |
2010 - 2018 National Fire Incident Reporting System (NFIRS) incidents
- Incident types reported to NFIRS in Deerfield Beach, FL
- 44,44369.7%Rescue & EMS
- 7,24911.4%Good Intent Call
- 5,4358.5%Service Call
- 3,0734.8%False Alarm
- 2,1623.4%Hazardous Condition
- 1,3952.2%Fire
- Fire incident types reported to NFIRS in Deerfield Beach, FL
- 54439.0%Outside Fires
- 49935.8%Structure Fires
- 33323.9%Mobile Property/Vehicle Fires
- 191.4%Other
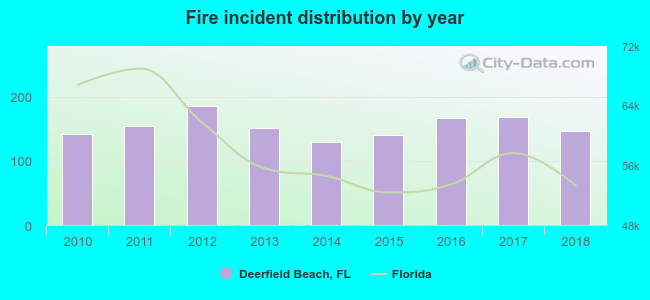 According to the data from the years 2010 - 2018 the average number of fire incidents per year is 154. The highest number of reported fire incidents - 186 took place in 2012, and the least - 130 in 2014. The data has an increasing trend.
The average number of yearly fire incidents per 10k residents in Deerfield Beach, FL compared to nearest cities:
(Note: Based on data for the last 3 years, including only cities with population 5,000 and above)
| Deerfield Beach: | 20.3 |
| Lighthouse Point: | 22.5 |
| Coconut Creek: | 13.4 |
| Boca Raton: | 21.4 |
| Pompano Beach: | 20.2 |
| Margate: | 17.2 |
| Parkland: | 4.4 |
| Coral Springs: | 3.5 |
| North Lauderdale: | 19.9 |
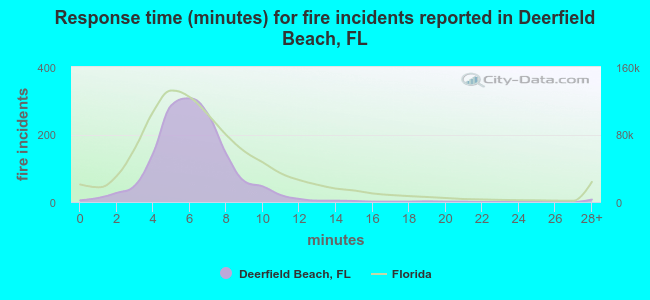 The median response time based on all reported fire incidents is 6 minutes. This is about the same as the state median value.
The median response time in Deerfield Beach, FL compared to nearest cities:
(Note: Based on data for all years, including only cities with at least 500 fire incidents)
| Deerfield Beach: | 6 minutes |
| Coconut Creek: | 6 minutes |
| Boca Raton: | 6 minutes |
| Pompano Beach: | 6 minutes |
| Margate: | 5 minutes |
| Coral Springs: | 5 minutes |
| North Lauderdale: | 5 minutes |
| Oakland Park: | 5 minutes |
| Tamarac: | 6 minutes |
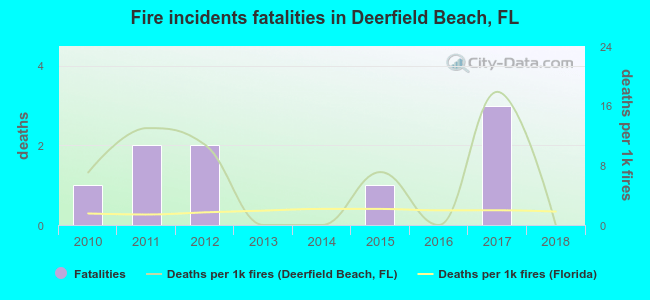 According to the reports from the years 2010 - 2018 the average number of fire-related yearly deaths is 1. The highest number of deaths - 3 took place in 2017, and the lowest - 0 in 2013. The data has a decreasing trend.
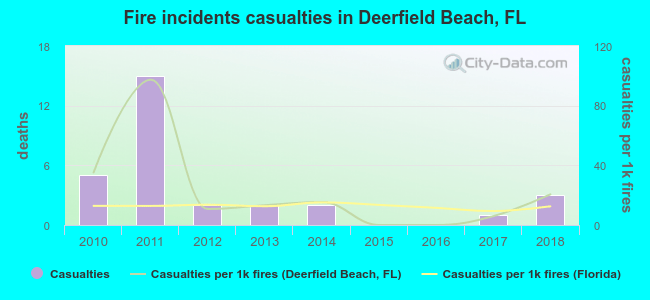 According to the data from the years 2010 - 2018 the average number of fire-related casualties per year is 3. The highest number of injuries - 15 took place in 2011, and the lowest - 0 in 2015. The data has a declining trend.
The average number of casualties per 1,000 fire incidents is 22. This indicator was the highest - 97 in 2011, and the lowest 0 in 2015. The trend for casualties per 1,000 fire incidents is dropping. Compared to the Florida value the number of casualties per 1,000 incidents is higher.
According to the data from the years 2010 - 2018 the average number of fire-related casualties per year is 3. The highest number of injuries - 15 took place in 2011, and the lowest - 0 in 2015. The data has a declining trend.
The average number of casualties per 1,000 fire incidents is 22. This indicator was the highest - 97 in 2011, and the lowest 0 in 2015. The trend for casualties per 1,000 fire incidents is dropping. Compared to the Florida value the number of casualties per 1,000 incidents is higher.Casualties per 1,000 incidents in Deerfield Beach, FL compared to nearest cities:
(Note: Based on data for all years, including only cities with at least 500 fire incidents)
| Deerfield Beach: | 21.5 |
| Coconut Creek: | 23.3 |
| Boca Raton: | 25.2 |
| Pompano Beach: | 41.3 |
| Margate: | 25.8 |
| Coral Springs: | 16.9 |
| North Lauderdale: | 7.7 |
| Oakland Park: | 0.5 |
| Tamarac: | 7.1 |
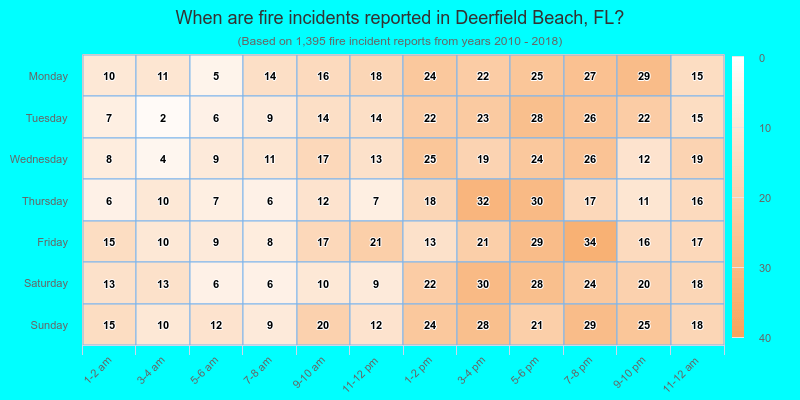
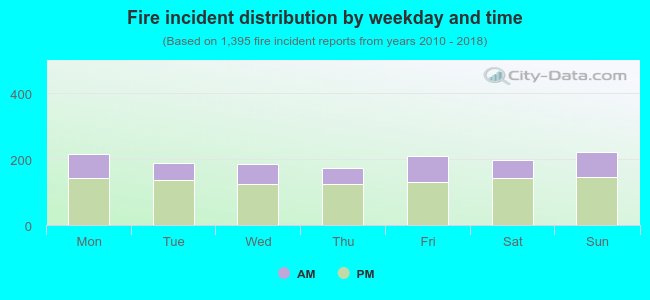 32.3% incidents where reported in the morning and 67.7% in the evening. The most fires (16.0%) took place on Sunday, and the least (12.3%) on Thursday.
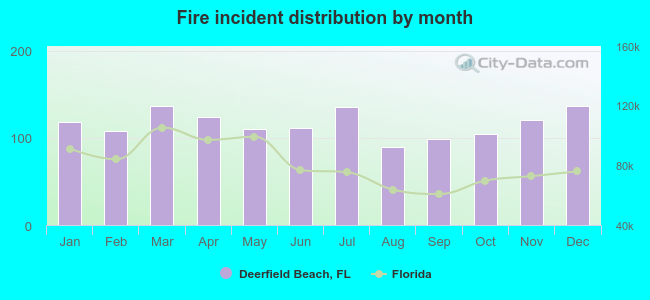 Based on the 1,395 incident reports from years 2010 - 2018 most fires (9.8%) took place during March, and the least (6.5%) in August.
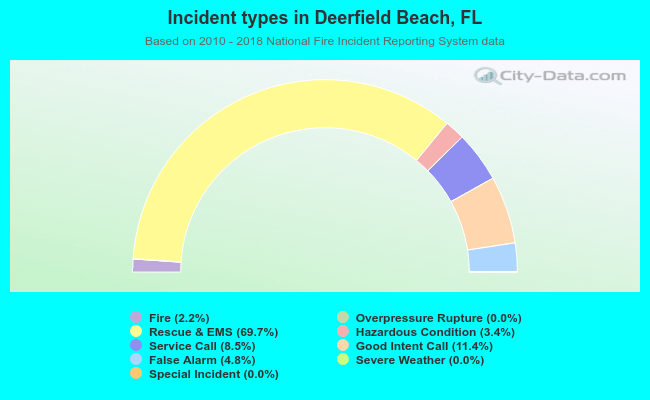 Out of all 63,785 cases reported during the years 2010 - 2018, the most belonged to the categories: Rescue & EMS (69.7%), Good Intent Call (11.4%), and Service Call (8.5%).
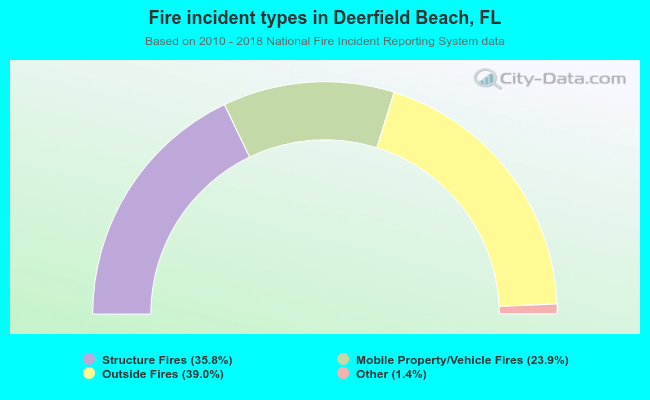 When looking into fire subcategories, the most reports belonged to: Outside Fires (39.0%), and Structure Fires (35.8%).