Tamarac: Fire Incidents, Florida (FL)
Where are fire incidents reported in Tamarac, FL
Something went wrong! Please refresh the page.
| Fire incidents reported | |
|---|---|
| Sreet name | Count |
| COMMERCIAL BLVD | 270 |
| UNIVERSITY DR | 202 |
| MCNAB RD | 94 |
| PINE ISLAND RD | 62 |
| NOB HILL RD | 50 |
| ROCK ISLAND RD | 44 |
| 70TH AVE | 42 |
| FLORIDA TPK RAMP | 40 |
| LIME BAY BLVD | 38 |
| SOUTHGATE BLVD | 38 |
| SR 7 | 38 |
| TREEHOUSE LN | 38 |
| COLONY CIR | 36 |
| FLORIDA TURNPIKE | 36 |
| 61ST ST | 32 |
| SAWGRASS RAMP | 30 |
| HIATUS RD | 28 |
| 64TH AVE | 26 |
| 73RD TER | 26 |
| LAKESIDE DR | 26 |
| SABAL PALM BLVD | 26 |
| SANDS POINT BLVD | 26 |
| WOODLANDS BLVD | 26 |
| 78TH AVE | 22 |
| 66TH TER | 20 |
| 80TH ST | 20 |
| 96TH TER | 20 |
| ISLAND CLUB DR | 20 |
| WESTWOOD DR | 20 |
| 31ST AVE | 18 |
| Other | 127 |
2002 - 2018 National Fire Incident Reporting System (NFIRS) incidents
- Incident types reported to NFIRS in Tamarac, FL
- 14,42651.6%Rescue & EMS
- 4,12314.7%Service Call
- 4,03114.4%Good Intent Call
- 2,2308.0%False Alarm
- 1,5725.6%Hazardous Condition
- 1,5415.5%Fire
- 280.1%Overpressure Rupture
- Fire incident types reported to NFIRS in Tamarac, FL
- 75048.7%Structure Fires
- 34622.5%Mobile Property/Vehicle Fires
- 29819.3%Outside Fires
- 1479.5%Other
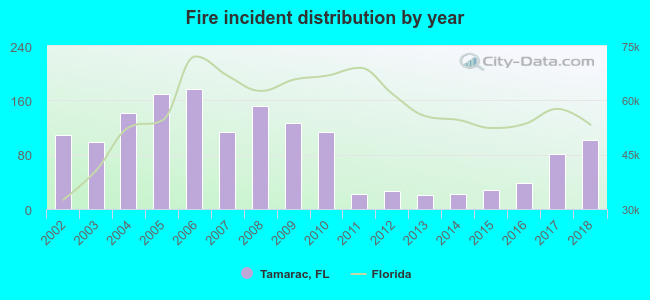 According to the data from the years 2002 - 2018 the average number of fires per year is 91. The highest number of fires - 177 took place in 2006, and the least - 20 in 2013. The data has a declining trend.
The average number of yearly fire incidents per 10k residents in Tamarac, FL compared to nearest cities:
(Note: Based on data for the last 3 years, including only cities with population 5,000 and above)
| Tamarac: | 11.5 |
| North Lauderdale: | 19.9 |
| Lauderhill: | 24.5 |
| Margate: | 17.2 |
| Lauderdale Lakes: | 22.5 |
| Sunrise: | 16.0 |
| Coral Springs: | 3.5 |
| Plantation: | 10.4 |
| Coconut Creek: | 13.4 |
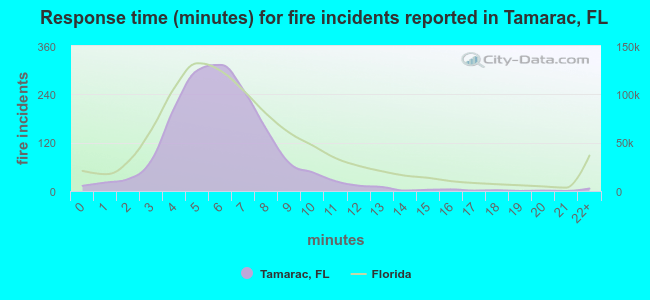 The median response time based on all reported fire incidents is 6 minutes. This is close to the Florida median value.
The median response time in Tamarac, FL compared to nearest cities:
(Note: Based on data for all years, including only cities with at least 500 fire incidents)
| Tamarac: | 6 minutes |
| North Lauderdale: | 5 minutes |
| Lauderhill: | 6 minutes |
| Margate: | 5 minutes |
| Lauderdale Lakes: | 6 minutes |
| Sunrise: | 6 minutes |
| Coral Springs: | 5 minutes |
| Plantation: | 7 minutes |
| Coconut Creek: | 6 minutes |
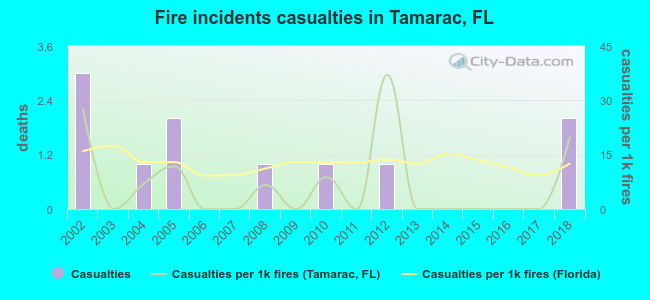 According to the data from the years 2002 - 2018 the average number of fire-related yearly casualties is 1. The highest number of casualties - 3 took place in 2002, and the lowest - 0 in 2003. The data has a declining trend.
The average number of casualties per 1,000 fire incidents is 7. This indicator was the highest - 37 in 2012, and the lowest 0 in 2003. The trend for casualties per 1,000 incidents is declining. Compared to the state value the number of casualties per 1,000 fires is lower.
According to the data from the years 2002 - 2018 the average number of fire-related yearly casualties is 1. The highest number of casualties - 3 took place in 2002, and the lowest - 0 in 2003. The data has a declining trend.
The average number of casualties per 1,000 fire incidents is 7. This indicator was the highest - 37 in 2012, and the lowest 0 in 2003. The trend for casualties per 1,000 incidents is declining. Compared to the state value the number of casualties per 1,000 fires is lower.Casualties per 1,000 incidents in Tamarac, FL compared to nearest cities:
(Note: Based on data for all years, including only cities with at least 500 fire incidents)
| Tamarac: | 7.1 |
| North Lauderdale: | 7.7 |
| Lauderhill: | 39.2 |
| Margate: | 25.8 |
| Lauderdale Lakes: | 31.3 |
| Sunrise: | 32.6 |
| Coral Springs: | 16.9 |
| Plantation: | 6.6 |
| Coconut Creek: | 23.3 |
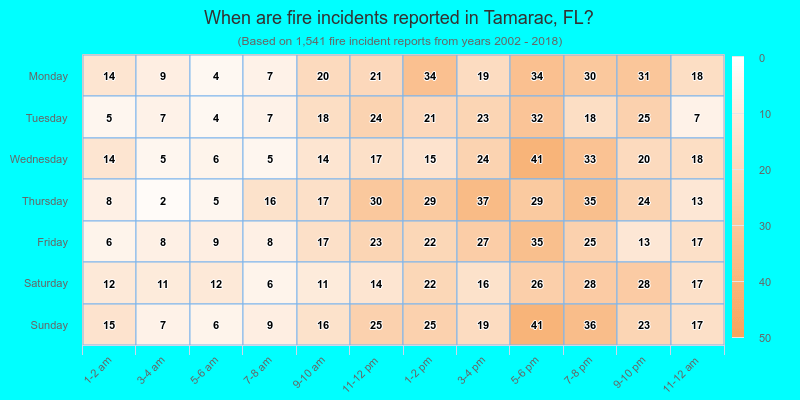
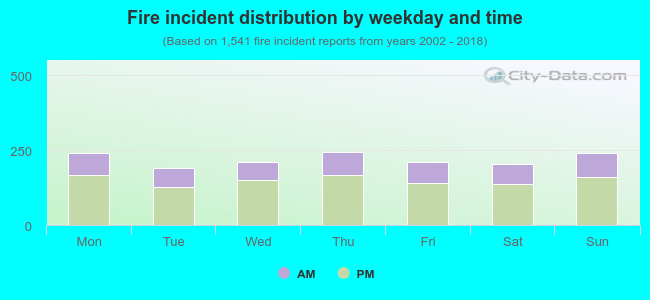 32.1% incidents where reported in the morning and 67.9% in the evening. The most fires (15.9%) took place on Thursday, and the least (12.4%) on Tuesday.
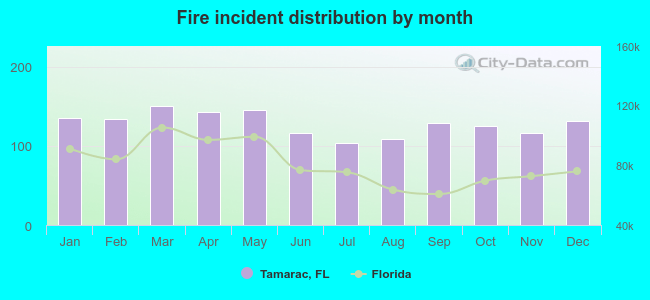 Based on the 1,541 incident reports from years 2002 - 2018 most fires (9.8%) took place during March, and the least (6.7%) in July.
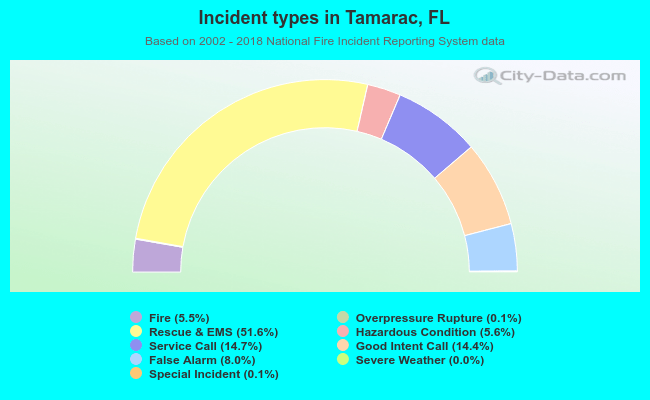 Out of all 27,984 cases reported during the years 2002 - 2018, the most belonged to the categories: Rescue & EMS (51.6%), Service Call (14.7%), and Good Intent Call (14.4%).
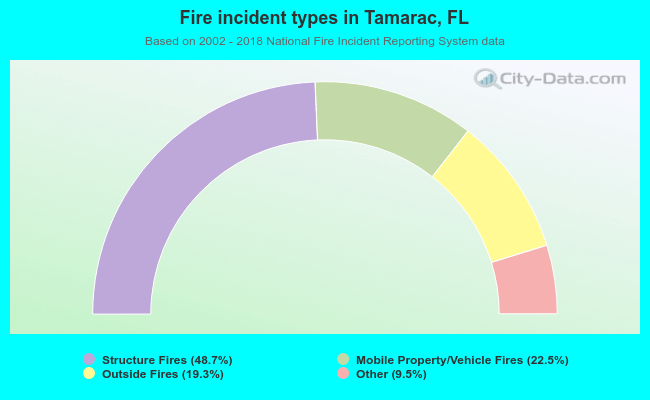 When looking into fire subcategories, the most incidents belonged to: Structure Fires (48.7%), and Mobile Property/Vehicle Fires (22.5%).