Sunrise: Fire Incidents, Florida (FL)
Where are fire incidents reported in Sunrise, FL
Something went wrong! Please refresh the page.
| Fire incidents reported | |
|---|---|
| Sreet name | Count |
| UNIVERSITY DR | 280 |
| SUNRISE BLVD | 210 |
| OAKLAND PARK BLVD | 184 |
| SUNRISE LAKES BLVD | 170 |
| SUNSET STRIP | 128 |
| SR 84 | 116 |
| OAKLAND PARK | 112 |
| NOB HILL RD | 98 |
| PINE ISLAND RD | 88 |
| SAWGRASS EXWY | 84 |
| HIATUS RD | 74 |
| 17TH PL | 58 |
| 44TH ST | 58 |
| 60TH AVE | 56 |
| 60TH TER | 56 |
| PINE IS | 46 |
| REFLECTIONS BLVD | 46 |
| 24TH PL | 44 |
| COMMERCIAL BLVD | 44 |
| 136TH AVE | 42 |
| 26TH ST | 38 |
| 16TH PL | 36 |
| 20TH CT | 36 |
| 30TH PL | 36 |
| 58TH TER | 36 |
| SUNRISE LAKES DR | 36 |
| FLAMINGO RD | 34 |
| 11TH ST | 32 |
| 64TH AVE | 32 |
| 25TH CT | 30 |
| Other | 54 |
2002 - 2018 National Fire Incident Reporting System (NFIRS) incidents
- Incident types reported to NFIRS in Sunrise, FL
- 50,95864.8%Rescue & EMS
- 9,93712.6%Good Intent Call
- 6,5298.3%Service Call
- 5,4276.9%False Alarm
- 3,3234.2%Hazardous Condition
- 2,3943.0%Fire
- Fire incident types reported to NFIRS in Sunrise, FL
- 97140.6%Structure Fires
- 78832.9%Outside Fires
- 51521.5%Mobile Property/Vehicle Fires
- 1205.0%Other
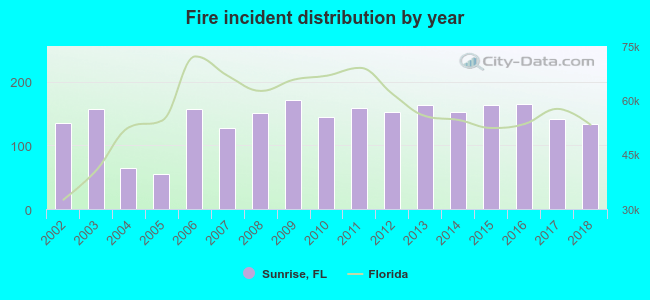 Based on the data from the years 2002 - 2018 the average number of fire incidents per year is 141. The highest number of fire incidents - 171 took place in 2009, and the least - 55 in 2005. The data has a decreasing trend.
The average number of yearly fire incidents per 10k residents in Sunrise, FL compared to nearest cities:
(Note: Based on data for the last 3 years, including only cities with population 5,000 and above)
| Sunrise: | 16.0 |
| Plantation: | 10.4 |
| Lauderhill: | 24.5 |
| Tamarac: | 11.5 |
| Davie: | 21.9 |
| Lauderdale Lakes: | 22.5 |
| North Lauderdale: | 19.9 |
| Weston: | 8.4 |
| Southwest Ranches: | 40.8 |
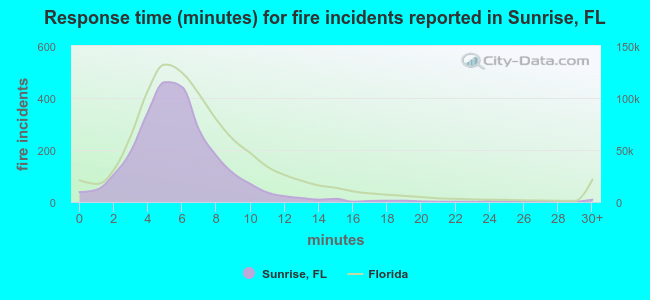 The median response time based on all reported fire incidents is 6 minutes. This is about the same as the state median value.
The median response time in Sunrise, FL compared to nearest cities:
(Note: Based on data for all years, including only cities with at least 500 fire incidents)
| Sunrise: | 6 minutes |
| Plantation: | 7 minutes |
| Lauderhill: | 6 minutes |
| Tamarac: | 6 minutes |
| Davie: | 7 minutes |
| Lauderdale Lakes: | 6 minutes |
| North Lauderdale: | 5 minutes |
| Weston: | 6 minutes |
| Southwest Ranches: | 7 minutes |
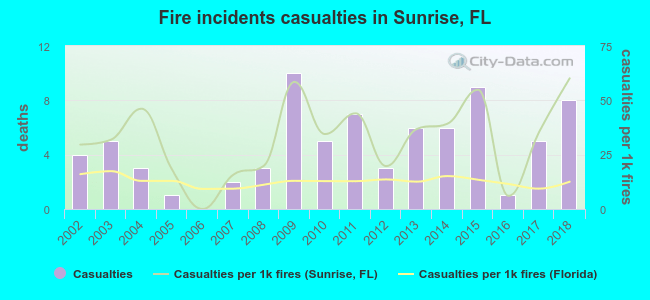 Based on the data from the years 2002 - 2018 the average number of fire-related casualties per year is 5. The highest number of reported injuries - 10 took place in 2009, and the lowest - 0 in 2006. The data has an increasing trend.
The average number of injuries per 1,000 fire incidents is 32. This indicator was the highest - 60 in 2018, and the lowest 0 in 2006. The trend for injuries per 1,000 fire incidents is growing. Compared to the Florida value the number of casualties per 1,000 fires is much higher.
Based on the data from the years 2002 - 2018 the average number of fire-related casualties per year is 5. The highest number of reported injuries - 10 took place in 2009, and the lowest - 0 in 2006. The data has an increasing trend.
The average number of injuries per 1,000 fire incidents is 32. This indicator was the highest - 60 in 2018, and the lowest 0 in 2006. The trend for injuries per 1,000 fire incidents is growing. Compared to the Florida value the number of casualties per 1,000 fires is much higher.Casualties per 1,000 incidents in Sunrise, FL compared to nearest cities:
(Note: Based on data for all years, including only cities with at least 500 fire incidents)
| Sunrise: | 32.6 |
| Plantation: | 6.6 |
| Lauderhill: | 39.2 |
| Tamarac: | 7.1 |
| Davie: | 14.2 |
| Lauderdale Lakes: | 31.3 |
| North Lauderdale: | 7.7 |
| Weston: | 21.2 |
| Southwest Ranches: | 3.0 |
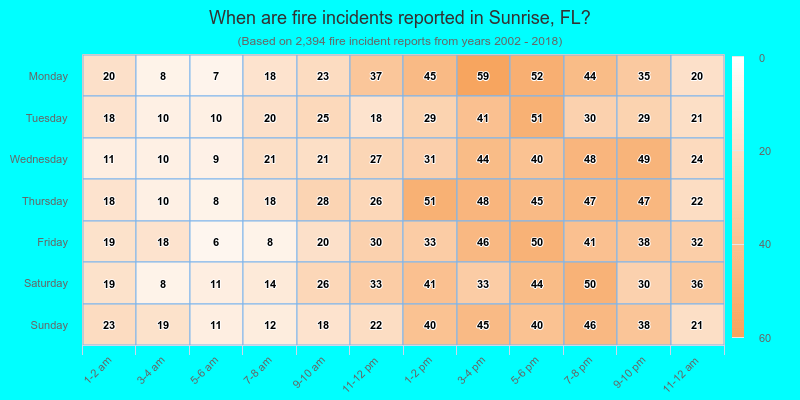
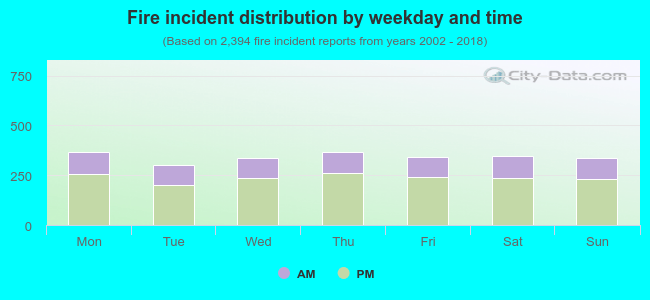 30.8% incidents where reported in the morning and 69.2% in the evening. The most fires (15.4%) took place on Monday, and the least (12.6%) on Tuesday.
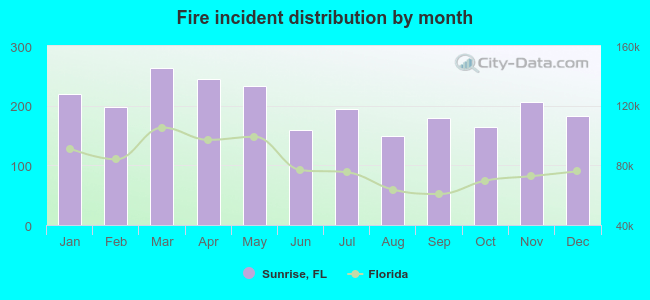 According to the 2,394 fire incidents from years 2002 - 2018 most fires (11.0%) took place during March, and the least (6.2%) in August.
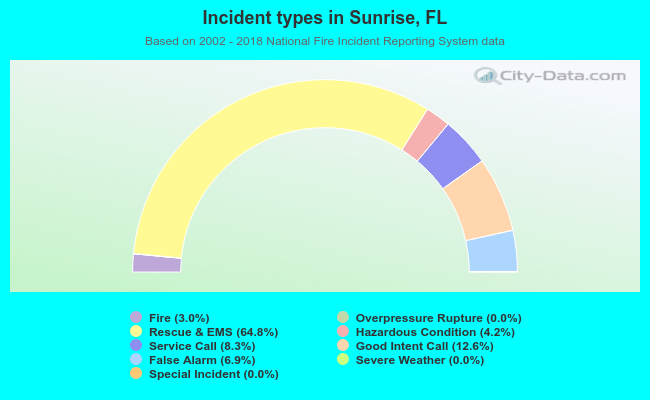 Out of all 78,625 cases reported during the years 2002 - 2018, the most belonged to the categories: Rescue & EMS (64.8%), Good Intent Call (12.6%), and Service Call (8.3%).
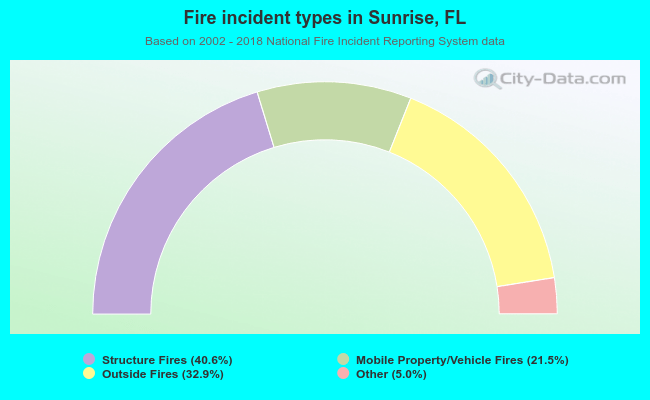 When looking into fire subcategories, the most incidents belonged to: Structure Fires (40.6%), and Outside Fires (32.9%).