Margate: Fire Incidents, Florida (FL)
Where are fire incidents reported in Margate, FL
Something went wrong! Please refresh the page.
| Fire incidents reported | |
|---|---|
| Sreet name | Count |
| SR 7 | 364 |
| ATLANTIC BLVD | 248 |
| BANKS RD | 144 |
| SAMPLE RD | 106 |
| ROCK ISLAND RD | 94 |
| RIVER DR | 78 |
| MARGATE BLVD | 76 |
| 65TH AVE | 70 |
| 1ST ST | 68 |
| PINEWALK N DR | 66 |
| ROYAL PALM BLVD | 64 |
| WINFIELD BLVD | 64 |
| 7TH ST | 62 |
| HOLIDAY SPRINGS BLVD | 62 |
| 80TH AVE | 60 |
| 8TH ST | 56 |
| 2ND CT | 54 |
| SOUTHGATE BLVD | 54 |
| LAKESIDE N DR | 50 |
| 18TH ST | 48 |
| COCONUT CREEK PKY | 48 |
| 56TH AVE | 42 |
| COPANS RD | 42 |
| 4TH ST | 38 |
| LAKEWOOD CIR | 38 |
| COLONIAL DR | 36 |
| 11TH ST | 34 |
| 66TH AVE | 34 |
| 15TH ST | 32 |
| SR 7 RD | 32 |
2002 - 2018 National Fire Incident Reporting System (NFIRS) incidents
- Incident types reported to NFIRS in Margate, FL
- 33,97866.5%Rescue & EMS
- 6,48812.7%Service Call
- 5,10010.0%Good Intent Call
- 1,9803.9%Fire
- 1,8513.6%False Alarm
- 1,6583.2%Hazardous Condition
- Fire incident types reported to NFIRS in Margate, FL
- 84842.8%Structure Fires
- 65633.1%Outside Fires
- 37018.7%Mobile Property/Vehicle Fires
- 1065.4%Other
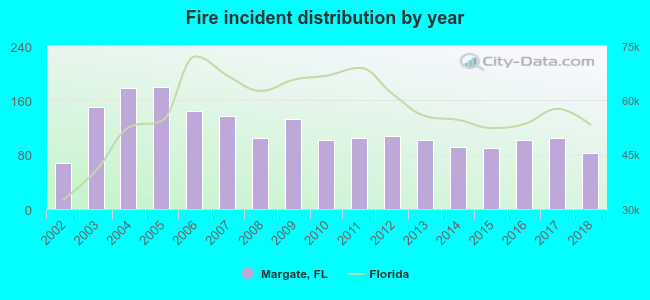 Based on the data from the years 2002 - 2018 the average number of fires per year is 116. The highest number of reported fires - 179 took place in 2005, and the least - 68 in 2002. The data has a growing trend.
The average number of yearly fire incidents per 10k residents in Margate, FL compared to nearest cities:
(Note: Based on data for the last 3 years, including only cities with population 5,000 and above)
| Margate: | 17.2 |
| North Lauderdale: | 19.9 |
| Coconut Creek: | 13.4 |
| Coral Springs: | 3.5 |
| Tamarac: | 11.5 |
| Parkland: | 4.4 |
| Lauderdale Lakes: | 22.5 |
| Pompano Beach: | 20.2 |
| Lauderhill: | 24.5 |
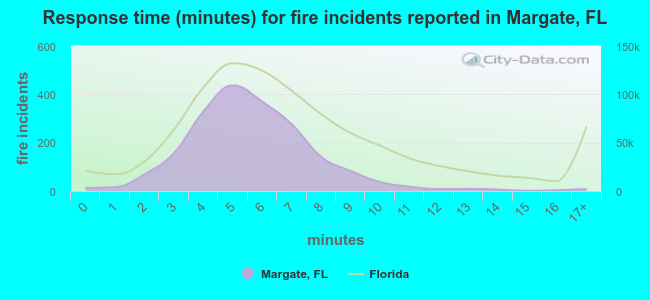 The median response time based on all reported fire incidents is 5 minutes. This is lower compared to the Florida median value.
The median response time in Margate, FL compared to nearest cities:
(Note: Based on data for all years, including only cities with at least 500 fire incidents)
| Margate: | 5 minutes |
| North Lauderdale: | 5 minutes |
| Coconut Creek: | 6 minutes |
| Coral Springs: | 5 minutes |
| Tamarac: | 6 minutes |
| Lauderdale Lakes: | 6 minutes |
| Pompano Beach: | 6 minutes |
| Lauderhill: | 6 minutes |
| Oakland Park: | 5 minutes |
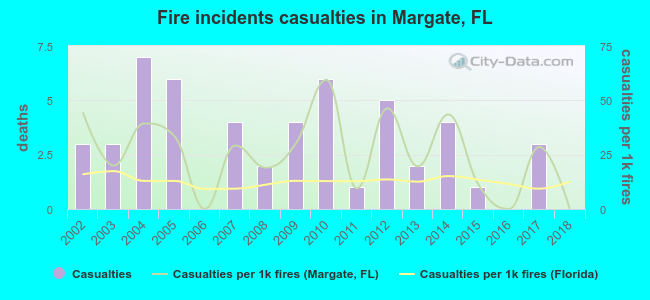 Based on the data from the years 2002 - 2018 the average number of fire-related yearly casualties is 3. The highest number of casualties - 7 took place in 2004, and the lowest - 0 in 2006. The data has a dropping trend.
The average number of injuries per 1,000 fire incidents is 26. This indicator was the highest - 59 in 2010, and the lowest 0 in 2006. The trend for injuries per 1,000 fire incidents is decreasing. Compared to the state value the number of casualties per 1,000 incidents is much higher.
Based on the data from the years 2002 - 2018 the average number of fire-related yearly casualties is 3. The highest number of casualties - 7 took place in 2004, and the lowest - 0 in 2006. The data has a dropping trend.
The average number of injuries per 1,000 fire incidents is 26. This indicator was the highest - 59 in 2010, and the lowest 0 in 2006. The trend for injuries per 1,000 fire incidents is decreasing. Compared to the state value the number of casualties per 1,000 incidents is much higher.Casualties per 1,000 incidents in Margate, FL compared to nearest cities:
(Note: Based on data for all years, including only cities with at least 500 fire incidents)
| Margate: | 25.8 |
| North Lauderdale: | 7.7 |
| Coconut Creek: | 23.3 |
| Coral Springs: | 16.9 |
| Tamarac: | 7.1 |
| Lauderdale Lakes: | 31.3 |
| Pompano Beach: | 41.3 |
| Lauderhill: | 39.2 |
| Oakland Park: | 0.5 |
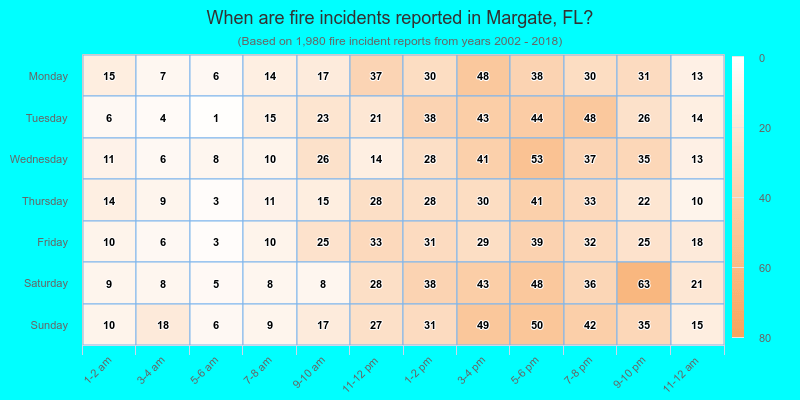
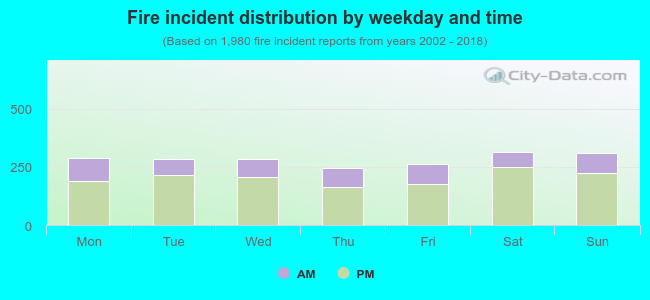 28.3% incidents where reported in the morning and 71.7% in the evening. The most fires (15.9%) took place on Saturday, and the least (12.3%) on Thursday.
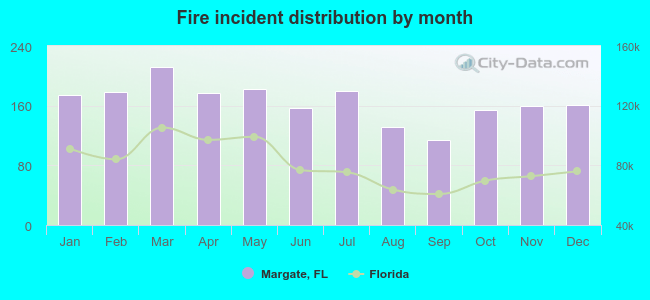 Based on the 1,980 incident reports from years 2002 - 2018 most fires (10.7%) took place during March, and the least (5.8%) in September.
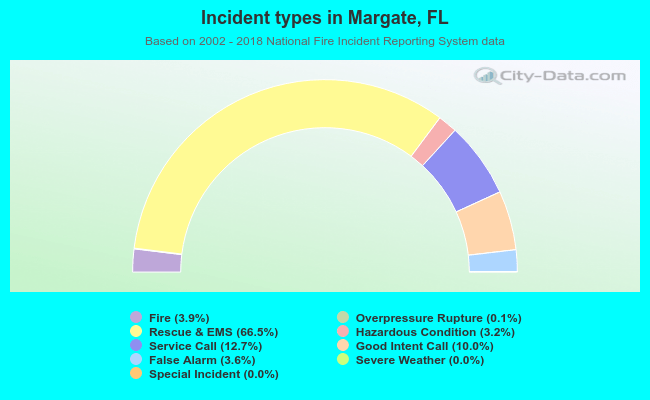 Out of all 51,126 cases reported during the years 2002 - 2018, the most belonged to the categories: Rescue & EMS (66.5%), Service Call (12.7%), and Good Intent Call (10.0%).
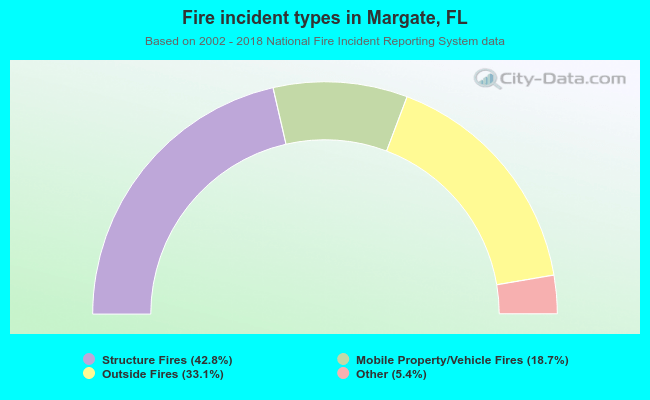 When looking into fire subcategories, the most reports belonged to: Structure Fires (42.8%), and Outside Fires (33.1%).