Parkland: Fire Incidents, Florida (FL)
Where are fire incidents reported in Parkland, FL
Something went wrong! Please refresh the page.
|
| |||||||||||||||||||||||||||||||||||||||||||||||||||||||||||||||||||||||||||||||||||||||||||||||||||||||||||||
2002 - 2018 National Fire Incident Reporting System (NFIRS) incidents
- Incident types reported to NFIRS in Parkland, FL
- 2,38159.2%Rescue & EMS
- 42910.7%False Alarm
- 3849.5%Hazardous Condition
- 2776.9%Fire
- 2756.8%Service Call
- 2566.4%Good Intent Call
- 90.2%Overpressure Rupture
- 80.2%Severe Weather
- Fire incident types reported to NFIRS in Parkland, FL
- 15857.0%Outside Fires
- 6122.0%Structure Fires
- 4917.7%Mobile Property/Vehicle Fires
- 93.2%Other
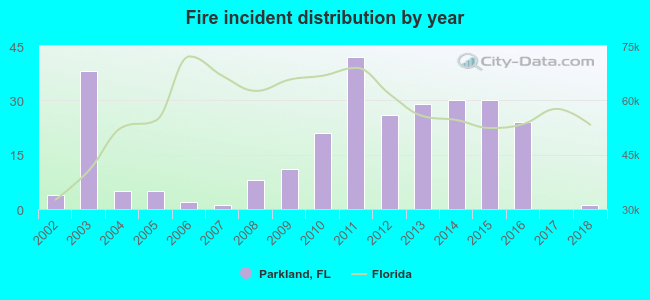 According to the data from the years 2002 - 2018 the average number of fires per year is 16. The highest number of reported fires - 42 took place in 2011, and the least - 0 in 2017. The data has a dropping trend.
The average number of yearly fire incidents per 10k residents in Parkland, FL compared to nearest cities:
(Note: Based on data for the last 3 years, including only cities with population 5,000 and above)
| Parkland: | 4.4 |
| Coral Springs: | 3.5 |
| Coconut Creek: | 13.4 |
| Margate: | 17.2 |
| North Lauderdale: | 19.9 |
| Deerfield Beach: | 20.3 |
| Tamarac: | 11.5 |
| Pompano Beach: | 20.2 |
| Boca Raton: | 21.4 |
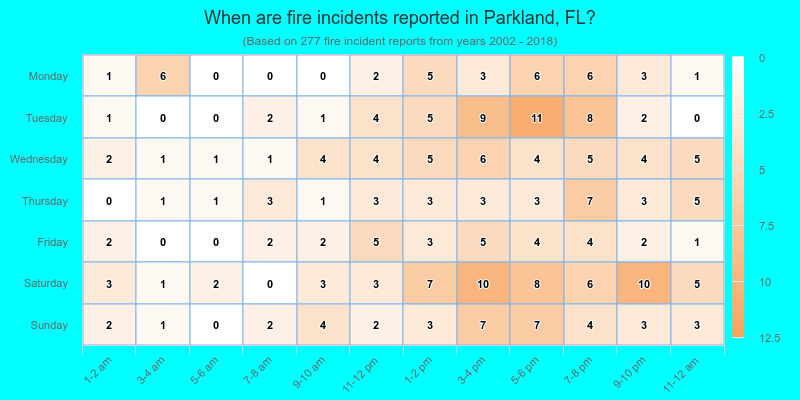
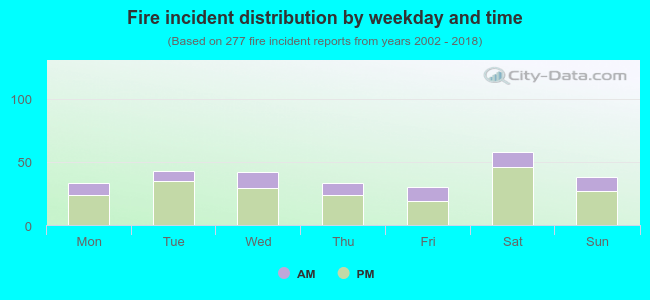 26.4% incidents where reported in the morning and 73.6% in the evening. The most fires (20.9%) took place on Saturday, and the least (10.8%) on Friday.
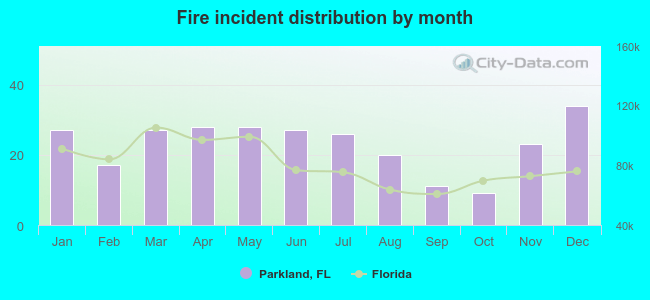 According to the 277 fire incidents from years 2002 - 2018 most fires (12.3%) took place during December, and the least (3.2%) in October.
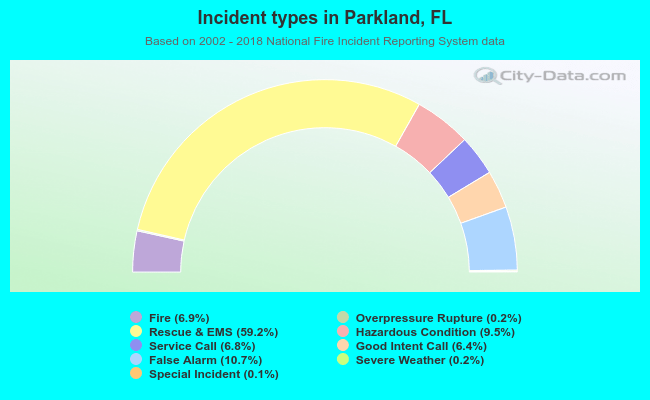 Out of all 4,022 cases reported during the years 2002 - 2018, the most belonged to the categories: Rescue & EMS (59.2%), False Alarm (10.7%), and Hazardous Condition (9.5%).
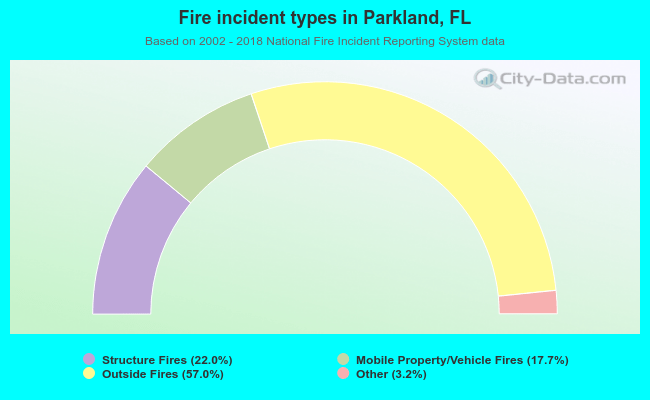 When looking into fire subcategories, the most incidents belonged to: Outside Fires (57.0%), and Structure Fires (22.0%).