Lighthouse Point: Fire Incidents, Florida (FL)
Where are fire incidents reported in Lighthouse Point, FL
Something went wrong! Please refresh the page.
|
| |||||||||||||||||||||||||||||||||||||||||||||||||||||||||||||||||||||||||||||||||||||||||||||||||||||||||||||
2005 - 2018 National Fire Incident Reporting System (NFIRS) incidents
- Incident types reported to NFIRS in Lighthouse Point, FL
- 3,91958.6%Rescue & EMS
- 1,06816.0%Hazardous Condition
- 4516.7%Good Intent Call
- 4356.5%Service Call
- 4036.0%Fire
- 3795.7%False Alarm
- 260.4%Special Incident
- Fire incident types reported to NFIRS in Lighthouse Point, FL
- 16240.2%Structure Fires
- 11528.5%Outside Fires
- 7418.4%Other
- 5212.9%Mobile Property/Vehicle Fires
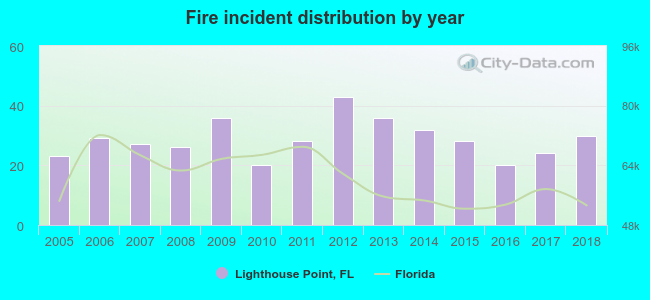 According to the data from the years 2005 - 2018 the average number of fire incidents per year is 29. The highest number of fires - 43 took place in 2012, and the least - 20 in 2010. The data has a growing trend.
The average number of yearly fire incidents per 10k residents in Lighthouse Point, FL compared to nearest cities:
(Note: Based on data for the last 3 years, including only cities with population 5,000 and above)
| Lighthouse Point: | 22.5 |
| Deerfield Beach: | 20.3 |
| Pompano Beach: | 20.2 |
| Coconut Creek: | 13.4 |
| Boca Raton: | 21.4 |
| Oakland Park: | 32.1 |
| Margate: | 17.2 |
| Wilton Manors: | 22.3 |
| North Lauderdale: | 19.9 |
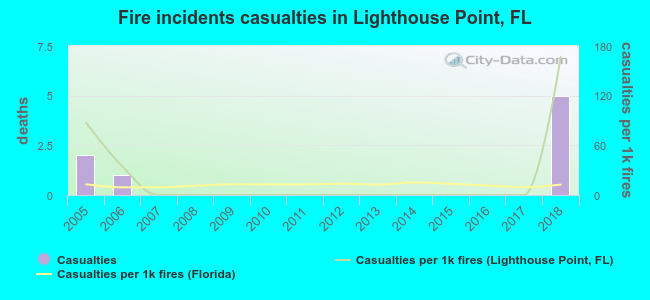 According to the data from the years 2005 - 2018 the average number of fire-related casualties per year is 1. The highest number of reported injuries - 5 took place in 2018, and the lowest - 0 in 2007. The data has a rising trend.
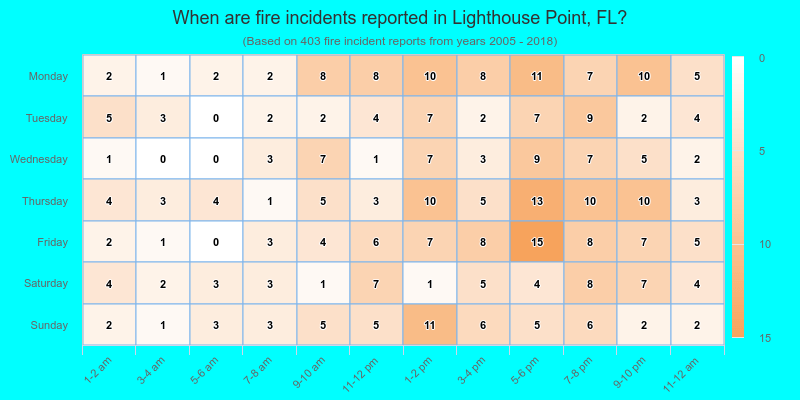
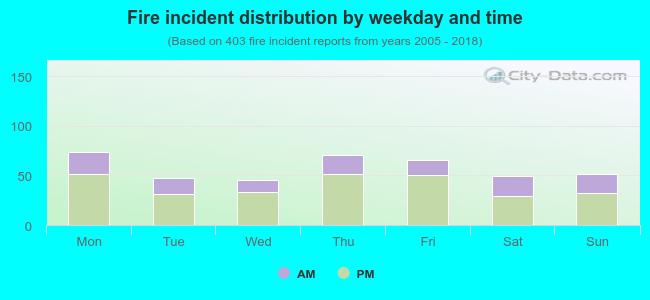 31.3% incidents where reported in the morning and 68.7% in the evening. The most fires (18.4%) took place on Monday, and the least (11.2%) on Wednesday.
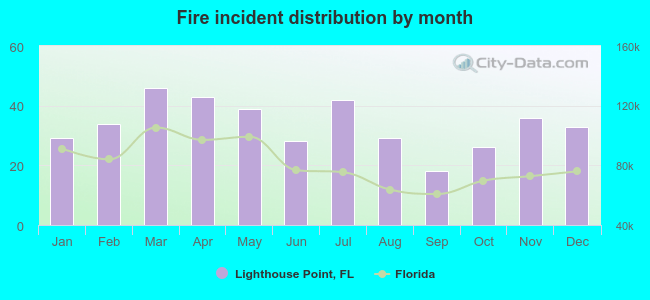 Based on the 403 incident reports from years 2005 - 2018 most fires (11.4%) took place during March, and the least (4.5%) in September.
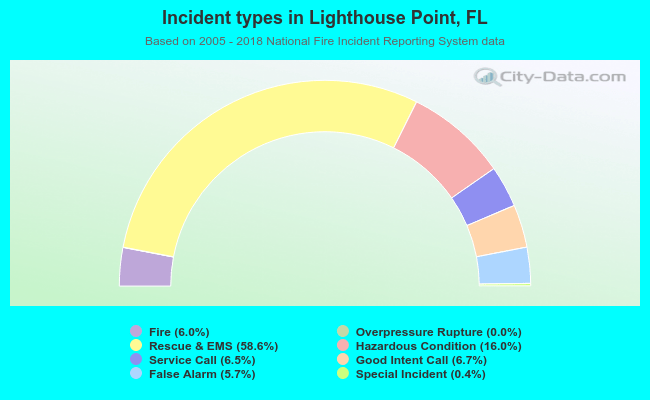 Out of all 6,684 cases reported during the years 2005 - 2018, the most belonged to the categories: Rescue & EMS (58.6%), Hazardous Condition (16.0%), and Good Intent Call (6.7%).
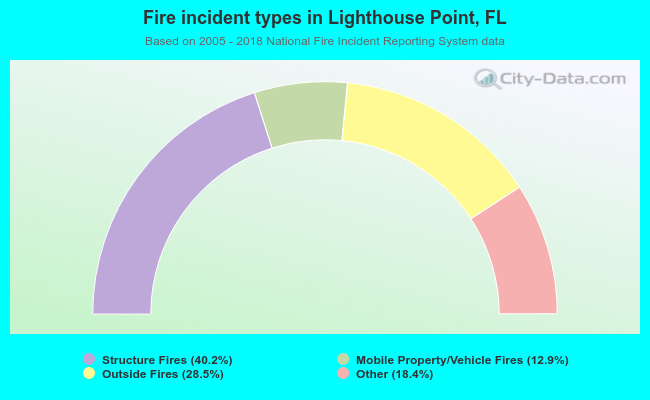 When looking into fire subcategories, the most incidents belonged to: Structure Fires (40.2%), and Outside Fires (28.5%).