Cambridge: Fire Incidents, Maryland (MD)
Where are fire incidents reported in Cambridge, MD
Something went wrong! Please refresh the page.
| Fire incidents reported | |
|---|---|
| Sreet name | Count |
| RACE ST | 218 |
| WASHINGTON ST | 170 |
| WOODS RD | 142 |
| HIGH ST | 90 |
| SUNBURST HWY | 78 |
| BUCKTOWN RD | 76 |
| HUDSON ROAD | 68 |
| LOCUST ST | 66 |
| HUDSON RD | 64 |
| GREENWOOD AVE | 60 |
| MUIR ST | 52 |
| PINE ST | 52 |
| MAPLE DAM RD | 40 |
| RT 50 | 38 |
| GLASGOW ST | 36 |
| CHOPTANK AVE | 34 |
| DORCHESTER SQUARE MALL | 34 |
| ROSS NECK ROAD | 34 |
| CAMBRIDGE BELTWAY | 32 |
| OCEAN GATEWAY | 32 |
| ROBBINS ST | 30 |
| ACADEMY ST | 28 |
| EGYPT RD | 28 |
| MORRIS NECK ROAD | 28 |
| CEDAR ST | 26 |
| SANDY HILL RD | 26 |
| AIREYS RD | 24 |
| CRUSADER RD | 24 |
| HAYWARD ST | 24 |
| HORNS POINT RD | 24 |
| Other | 661 |
2002 - 2018 National Fire Incident Reporting System (NFIRS) incidents
- Incident types reported to NFIRS in Cambridge, MD
- 2,33929.7%Fire
- 2,03625.8%Good Intent Call
- 1,44018.3%Rescue & EMS
- 1,19515.2%Hazardous Condition
- 6388.1%False Alarm
- 1792.3%Service Call
- 440.6%Overpressure Rupture
- Fire incident types reported to NFIRS in Cambridge, MD
- 1,30255.7%Structure Fires
- 62226.6%Outside Fires
- 2129.1%Mobile Property/Vehicle Fires
- 2038.7%Other
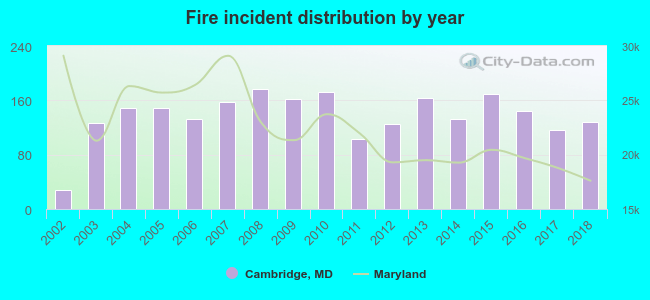 Based on the data from the years 2002 - 2018 the average number of fires per year is 138. The highest number of reported fires - 177 took place in 2008, and the least - 28 in 2002. The data has a rising trend.
The average number of yearly fire incidents per 10k residents in Cambridge, MD compared to nearest cities:
(Note: Based on data for the last 3 years, including only cities with population 5,000 and above)
| Cambridge: | 103.4 |
| Easton: | 68.0 |
| Chesapeake Beach: | 28.4 |
| California: | 62.1 |
| Lexington Park: | 105.2 |
| Salisbury: | 82.1 |
| Fruitland: | 78.1 |
| Shady Side: | 6.9 |
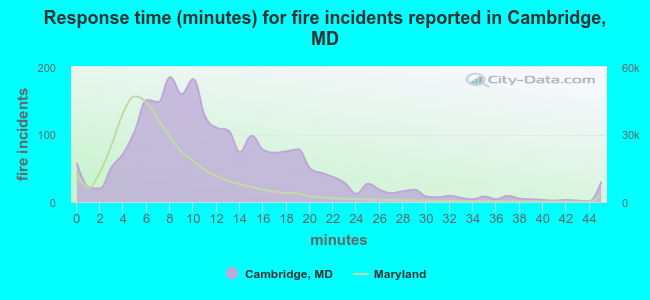 The median response time based on all reported fire incidents is 11 minutes. This is higher compared to the Maryland median value.
The median response time in Cambridge, MD compared to nearest cities:
(Note: Based on data for all years, including only cities with at least 500 fire incidents)
| Cambridge: | 11 minutes |
| Hurlock: | 9 minutes |
| Preston: | 11 minutes |
| Easton: | 8 minutes |
| Federalsburg: | 10 minutes |
| Hebron: | 9 minutes |
| Lusby: | 8 minutes |
| Seaford: | 7 minutes |
| Denton: | 10 minutes |
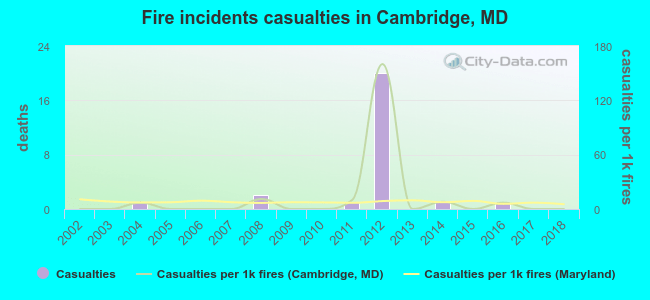 Based on the reports from the years 2002 - 2018 the average number of fire-related casualties per year is 2. The highest number of reported casualties - 20 took place in 2012, and the lowest - 0 in 2002. The data has a constant trend.
The average number of injuries per 1,000 fire incidents is 12. This indicator was the highest - 160 in 2012, and the lowest 0 in 2002. The trend for casualties per 1,000 incidents is constant. Compared to the Maryland value the number of casualties per 1,000 fire incidents is higher.
Based on the reports from the years 2002 - 2018 the average number of fire-related casualties per year is 2. The highest number of reported casualties - 20 took place in 2012, and the lowest - 0 in 2002. The data has a constant trend.
The average number of injuries per 1,000 fire incidents is 12. This indicator was the highest - 160 in 2012, and the lowest 0 in 2002. The trend for casualties per 1,000 incidents is constant. Compared to the Maryland value the number of casualties per 1,000 fire incidents is higher.
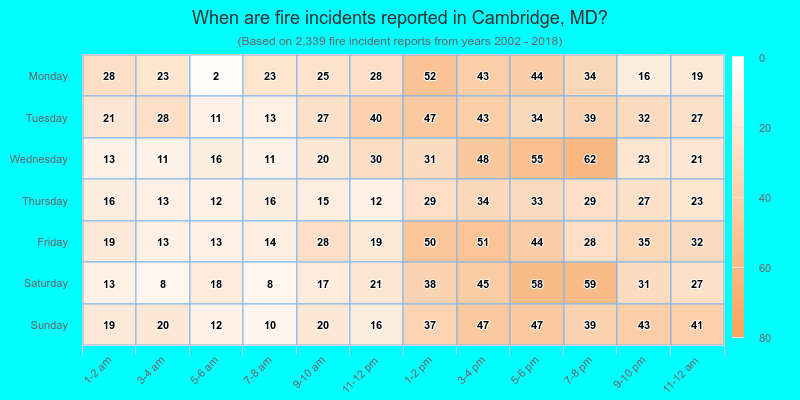
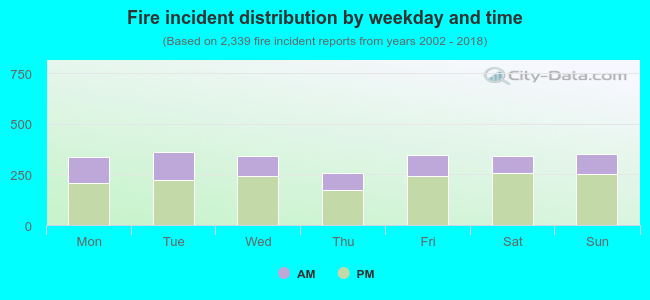 31.7% incidents where reported in the morning and 68.3% in the evening. The most fires (15.5%) took place on Tuesday, and the least (11.1%) on Thursday.
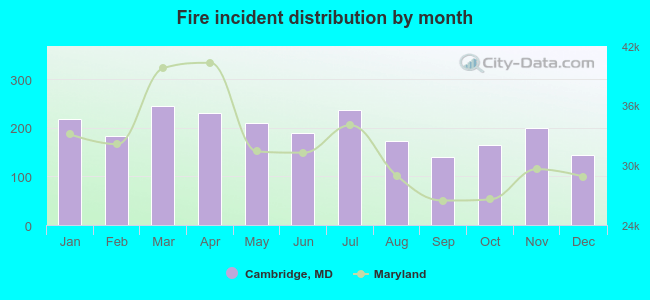 Based on the 2,339 reports from years 2002 - 2018 most fires (10.5%) took place during March, and the least (6.0%) in September.
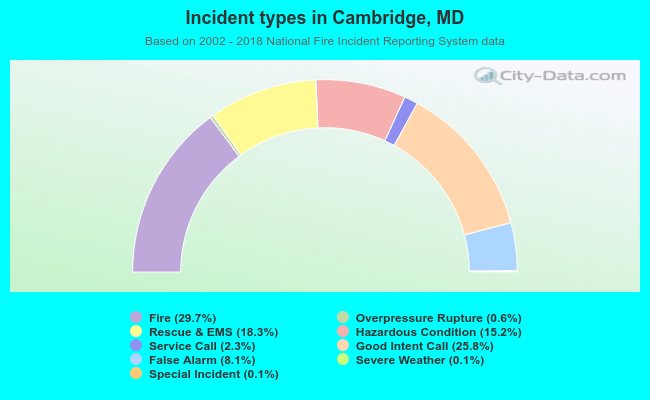 Out of all 7,883 cases reported during the years 2002 - 2018, the most belonged to the categories: Fire (29.7%), Good Intent Call (25.8%), and Rescue & EMS (18.3%).
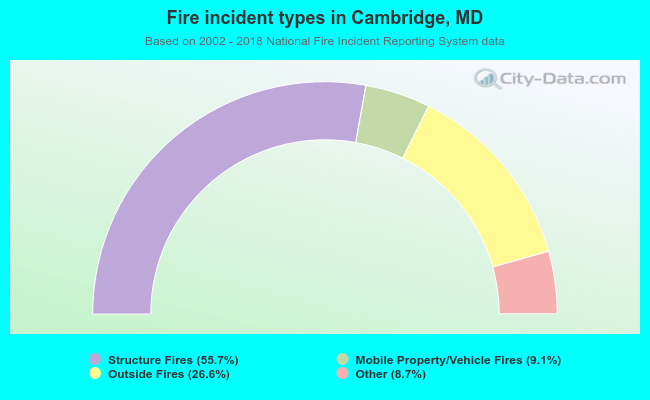 When looking into fire subcategories, the most incidents belonged to: Structure Fires (55.7%), and Outside Fires (26.6%).