Chesapeake Beach: Fire Incidents, Maryland (MD)
Where are fire incidents reported in Chesapeake Beach, MD
Something went wrong! Please refresh the page.
|
| |||||||||||||||||||||||||||||||||||||||||||||||||||||||||||||||||||||||||||||||||||||||||||||||||||||||||||||
2002 - 2018 National Fire Incident Reporting System (NFIRS) incidents
- Incident types reported to NFIRS in Chesapeake Beach, MD
- 2,99146.8%Rescue & EMS
- 2,01331.5%Good Intent Call
- 65010.2%Hazardous Condition
- 4016.3%Fire
- 2453.8%Service Call
- 821.3%False Alarm
- Fire incident types reported to NFIRS in Chesapeake Beach, MD
- 23057.4%Structure Fires
- 8320.7%Outside Fires
- 6917.2%Other
- 194.7%Mobile Property/Vehicle Fires
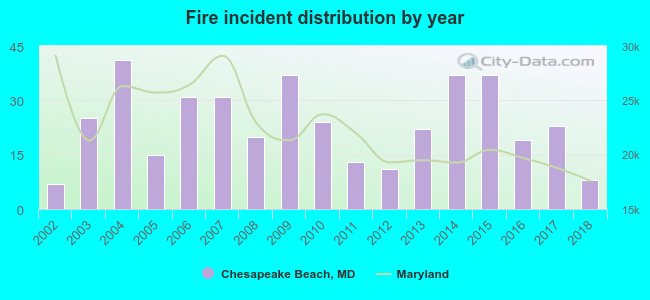 According to the data from the years 2002 - 2018 the average number of fire incidents per year is 24. The highest number of fire incidents - 41 took place in 2004, and the least - 7 in 2002. The data has a growing trend.
The average number of yearly fire incidents per 10k residents in Chesapeake Beach, MD compared to nearest cities:
(Note: Based on data for the last 3 years, including only cities with population 5,000 and above)
| Chesapeake Beach: | 28.4 |
| Shady Side: | 6.9 |
| Mayo: | 1.2 |
| Brandywine: | 86.3 |
| Edgewater: | 45.4 |
| Annapolis: | 64.3 |
| Waldorf: | 63.0 |
| Clinton: | 5.4 |
| Bowie: | 7.9 |

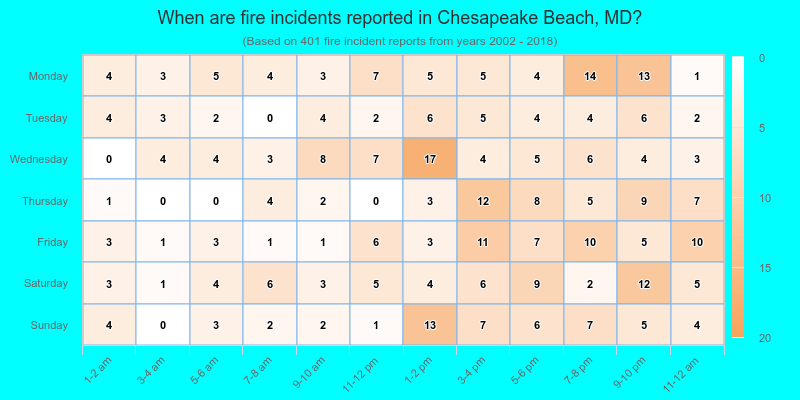
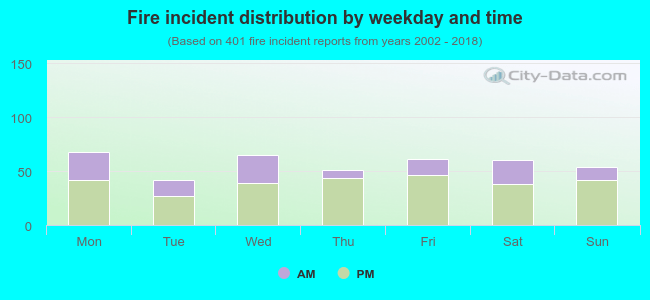 30.7% incidents where reported in the morning and 69.3% in the evening. The most fires (17.0%) took place on Monday, and the least (10.5%) on Tuesday.
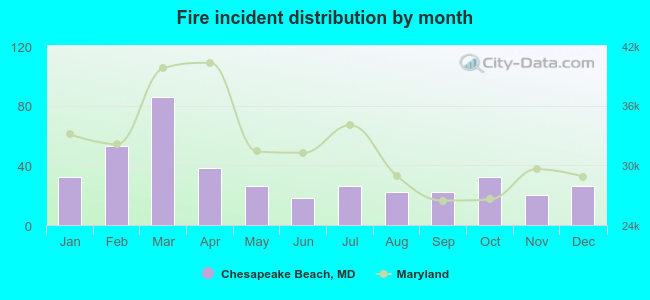 According to the 401 fires from years 2002 - 2018 most fires (21.4%) took place during March, and the least (4.5%) in June.
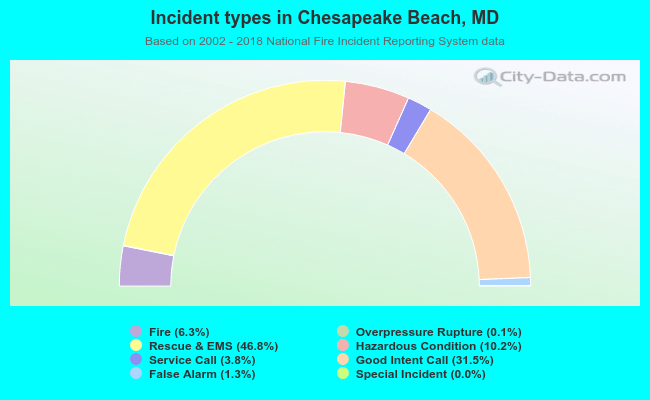 Out of all 6,388 cases reported during the years 2002 - 2018, the most belonged to the categories: Rescue & EMS (46.8%), Good Intent Call (31.5%), and Hazardous Condition (10.2%).
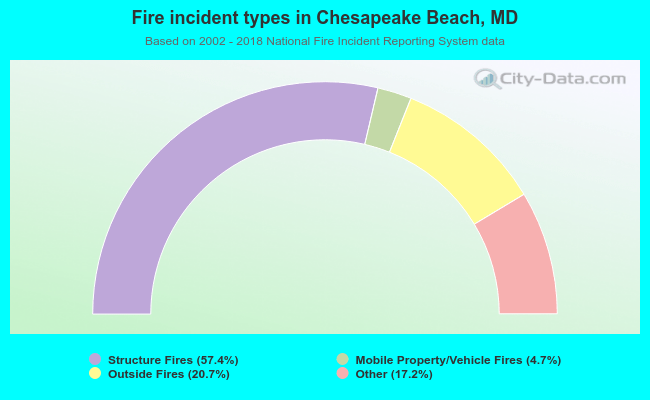 When looking into fire subcategories, the most incidents belonged to: Structure Fires (57.4%), and Outside Fires (20.7%).