Hurlock: Fire Incidents, Maryland (MD)
Where are fire incidents reported in Hurlock, MD
Something went wrong! Please refresh the page.
|
| |||||||||||||||||||||||||||||||||||||||||||||||||||||||||||||||||||||||||||||||||||||||||||||||||||||||||||||
| Other | 327 | |||||||||||||||||||||||||||||||||||||||||||||||||||||||||||||||||||||||||||||||||||||||||||||||||||||||||||||
2002 - 2018 National Fire Incident Reporting System (NFIRS) incidents
- Incident types reported to NFIRS in Hurlock, MD
- 1,08940.6%Fire
- 63623.7%Rescue & EMS
- 45817.1%Good Intent Call
- 2228.3%Hazardous Condition
- 1425.3%False Alarm
- 1064.0%Service Call
- 220.8%Overpressure Rupture
- 40.1%Severe Weather
- 30.1%Special Incident
- Fire incident types reported to NFIRS in Hurlock, MD
- 51046.8%Structure Fires
- 41538.1%Outside Fires
- 11310.4%Mobile Property/Vehicle Fires
- 514.7%Other
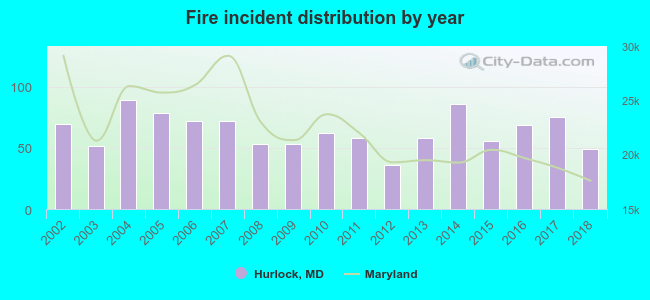 According to the data from the years 2002 - 2018 the average number of fires per year is 64. The highest number of fire incidents - 89 took place in 2004, and the least - 36 in 2012. The data has a dropping trend.
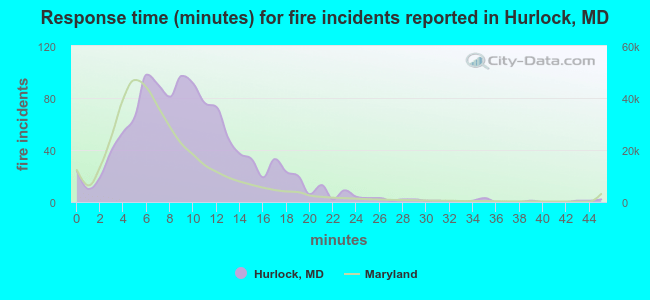 The median response time based on all reported fire incidents is 9 minutes. This is higher than the state median value.
The median response time in Hurlock, MD compared to nearest cities:
(Note: Based on data for all years, including only cities with at least 500 fire incidents)
| Hurlock: | 9 minutes |
| Preston: | 11 minutes |
| Federalsburg: | 10 minutes |
| Cambridge: | 11 minutes |
| Seaford: | 7 minutes |
| Easton: | 8 minutes |
| Bridgeville: | 9 minutes |
| Laurel: | 10 minutes |
| Hebron: | 9 minutes |
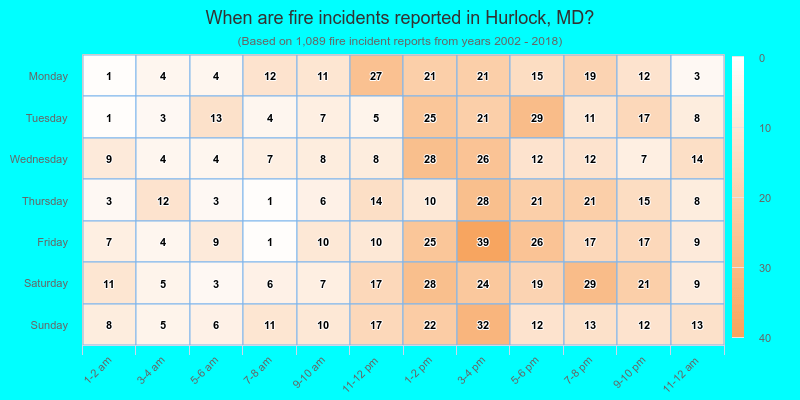
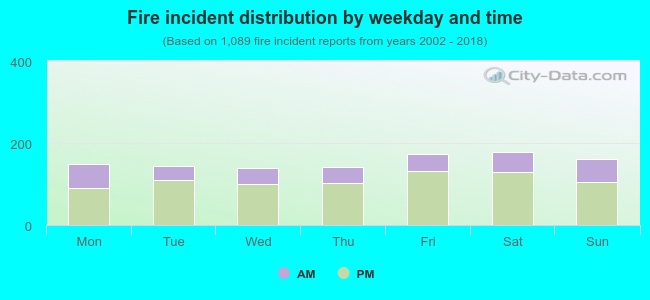 29.2% incidents where reported in the morning and 70.8% in the evening. The most fires (16.4%) took place on Saturday, and the least (12.8%) on Wednesday.
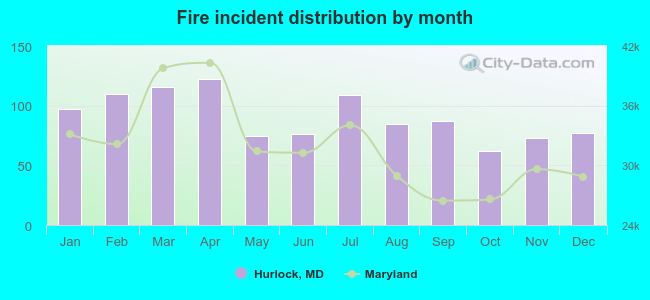 According to the 1,089 incident reports from years 2002 - 2018 most fires (11.2%) took place during April, and the least (5.7%) in October.
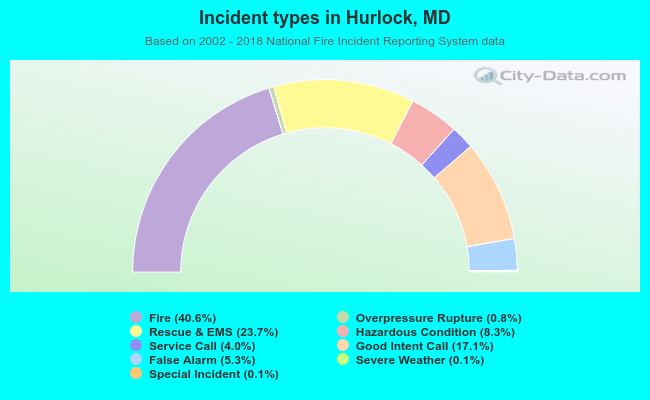 Out of all 2,682 cases reported during the years 2002 - 2018, the most belonged to the categories: Fire (40.6%), Rescue & EMS (23.7%), and Good Intent Call (17.1%).
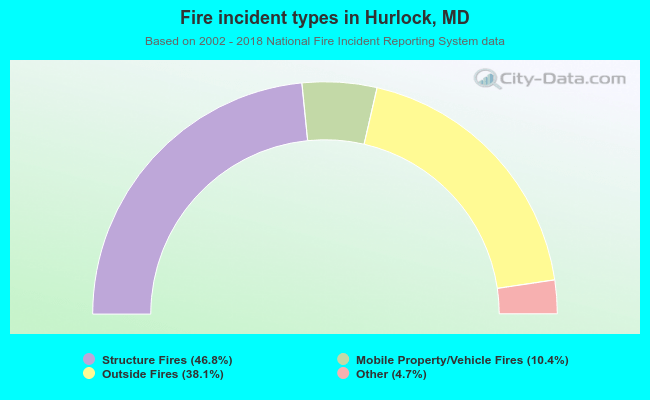 When looking into fire subcategories, the most incidents belonged to: Structure Fires (46.8%), and Outside Fires (38.1%).