Lusby: Fire Incidents, Maryland (MD)
Where are fire incidents reported in Lusby, MD
Something went wrong! Please refresh the page.
|
| |||||||||||||||||||||||||||||||||||||||||||||||||||||||||||||||||||||||||||||||||||||||||||||||||||||||||||||
| Other | 260 | |||||||||||||||||||||||||||||||||||||||||||||||||||||||||||||||||||||||||||||||||||||||||||||||||||||||||||||
2002 - 2018 National Fire Incident Reporting System (NFIRS) incidents
- Incident types reported to NFIRS in Lusby, MD
- 6,78050.7%Rescue & EMS
- 3,41425.5%Good Intent Call
- 1,2459.3%Hazardous Condition
- 1,0387.8%Fire
- 6945.2%Service Call
- 1681.3%False Alarm
- 440.3%Severe Weather
- Fire incident types reported to NFIRS in Lusby, MD
- 52750.8%Structure Fires
- 27026.0%Outside Fires
- 12912.4%Other
- 11210.8%Mobile Property/Vehicle Fires
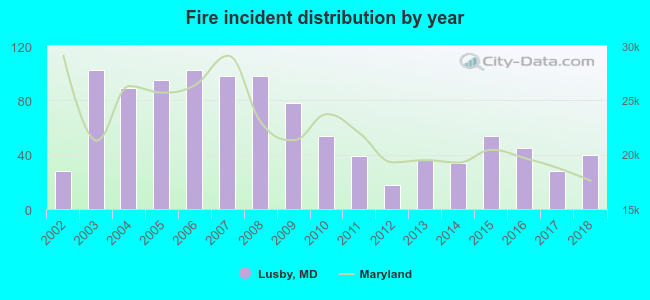 Based on the data from the years 2002 - 2018 the average number of fire incidents per year is 61. The highest number of reported fires - 102 took place in 2003, and the least - 18 in 2012. The data has a rising trend.
 The median response time based on all reported fire incidents is 8 minutes. This is comparable to the Maryland median value.
The median response time in Lusby, MD compared to nearest cities:
(Note: Based on data for all years, including only cities with at least 500 fire incidents)
| Lusby: | 8 minutes |
| Solomons: | 9 minutes |
| California: | 6 minutes |
| Lexington Park: | 6 minutes |
| Leonardtown: | 8 minutes |
| Prince Frederick: | 6 minutes |
| Mechanicsville: | 10 minutes |
| Charlotte Hall: | 10 minutes |
| Huntingtown: | 7 minutes |
 30.0% incidents where reported in the morning and 70.0% in the evening. The most fires (17.3%) took place on Sunday, and the least (9.5%) on Tuesday.
 Based on the 1,038 fire incident reports from years 2002 - 2018 most fires (15.6%) took place during February, and the least (4.8%) in September.
 Out of all 13,385 cases reported during the years 2002 - 2018, the most belonged to the categories: Rescue & EMS (50.7%), Good Intent Call (25.5%), and Hazardous Condition (9.3%).
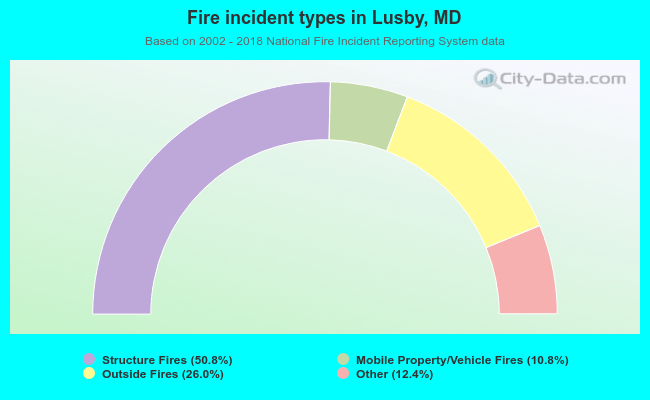 When looking into fire subcategories, the most incidents belonged to: Structure Fires (50.8%), and Outside Fires (26.0%).