Fruitland: Fire Incidents, Maryland (MD)
Where are fire incidents reported in Fruitland, MD
Something went wrong! Please refresh the page.
|
| |||||||||||||||||||||||||||||||||||||||||||||||||||||||||||||||||||||||||||||||||||||||||||||||||||||||||||||
2002 - 2018 National Fire Incident Reporting System (NFIRS) incidents
- Incident types reported to NFIRS in Fruitland, MD
- 74931.4%Fire
- 69429.1%Rescue & EMS
- 54322.8%Hazardous Condition
- 1626.8%False Alarm
- 1185.0%Good Intent Call
- 1094.6%Service Call
- 70.3%Special Incident
- Fire incident types reported to NFIRS in Fruitland, MD
- 38150.9%Structure Fires
- 24232.3%Outside Fires
- 9312.4%Mobile Property/Vehicle Fires
- 334.4%Other
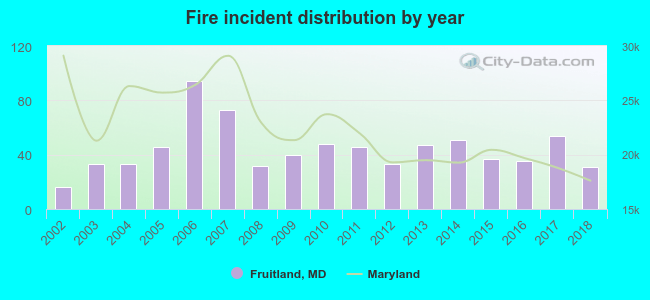 Based on the data from the years 2002 - 2018 the average number of fire incidents per year is 44. The highest number of fire incidents - 94 took place in 2006, and the least - 16 in 2002. The data has an increasing trend.
The average number of yearly fire incidents per 10k residents in Fruitland, MD compared to nearest cities:
(Note: Based on data for the last 3 years, including only cities with population 5,000 and above)
| Fruitland: | 78.1 |
| Salisbury: | 82.1 |
| Ocean Pines: | 7.4 |
| Cambridge: | 103.4 |
| Ocean City: | 153.8 |
 The median response time based on all reported fire incidents is 8 minutes. This is comparable to the Maryland median value.
The median response time in Fruitland, MD compared to nearest cities:
(Note: Based on data for all years, including only cities with at least 500 fire incidents)
| Fruitland: | 8 minutes |
| Salisbury: | 5 minutes |
| Hebron: | 9 minutes |
| Princess Anne: | 11 minutes |
| Delmar: | 8 minutes |
| Delmar: | 9 minutes |
| Laurel: | 10 minutes |
| Pocomoke City: | 7 minutes |
| Berlin: | 7 minutes |
 28.7% incidents where reported in the morning and 71.3% in the evening. The most fires (18.6%) took place on Saturday, and the least (10.4%) on Thursday.
 Based on the 749 fires from years 2002 - 2018 most fires (11.3%) took place during March, and the least (5.9%) in September.
 Out of all 2,383 cases reported during the years 2002 - 2018, the most belonged to the categories: Fire (31.4%), Rescue & EMS (29.1%), and Hazardous Condition (22.8%).
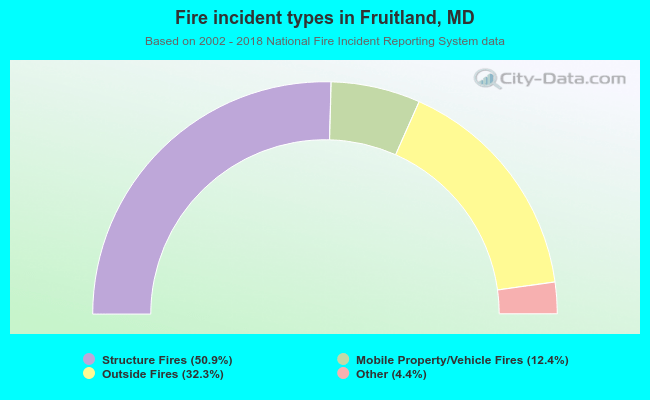 When looking into fire subcategories, the most incidents belonged to: Structure Fires (50.9%), and Outside Fires (32.3%).