Delmar: Fire Incidents, Delaware (DE)
Where are fire incidents reported in Delmar, DE
Something went wrong! Please refresh the page.
|
| |||||||||||||||||||||||||||||||||||||||||||||||||||||||||||||||||||||||||||||||||||||||||||||||||||||||||||||
| Other | 65 | |||||||||||||||||||||||||||||||||||||||||||||||||||||||||||||||||||||||||||||||||||||||||||||||||||||||||||||
2002 - 2018 National Fire Incident Reporting System (NFIRS) incidents
- Incident types reported to NFIRS in Delmar, DE
- 69538.4%Fire
- 52328.9%Rescue & EMS
- 31817.6%Hazardous Condition
- 1156.4%False Alarm
- 925.1%Service Call
- 573.2%Good Intent Call
- 50.3%Overpressure Rupture
- 30.2%Special Incident
- Fire incident types reported to NFIRS in Delmar, DE
- 31945.9%Structure Fires
- 23634.0%Outside Fires
- 9613.8%Mobile Property/Vehicle Fires
- 446.3%Other
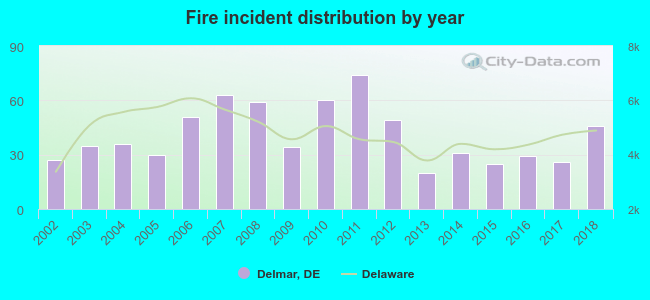 According to the data from the years 2002 - 2018 the average number of fires per year is 41. The highest number of reported fire incidents - 74 took place in 2011, and the least - 20 in 2013. The data has an increasing trend.
 The median response time based on all reported fire incidents is 9 minutes. This is higher compared to the state median value.
The median response time in Delmar, DE compared to nearest cities:
(Note: Based on data for all years, including only cities with at least 500 fire incidents)
| Delmar: | 9 minutes |
| Laurel: | 10 minutes |
| Seaford: | 7 minutes |
| Millsboro: | 9 minutes |
| Frankford: | 8 minutes |
| Dagsboro: | 9 minutes |
| Georgetown: | 9 minutes |
| Bridgeville: | 9 minutes |
| Greenwood: | 10 minutes |
 28.5% incidents where reported in the morning and 71.5% in the evening. The most fires (16.7%) took place on Tuesday, and the least (11.9%) on Wednesday.
 Based on the 695 incident reports from years 2002 - 2018 most fires (10.1%) took place during March, and the least (6.3%) in October.
 Out of all 1,809 cases reported during the years 2002 - 2018, the most belonged to the categories: Fire (38.4%), Rescue & EMS (28.9%), and Hazardous Condition (17.6%).
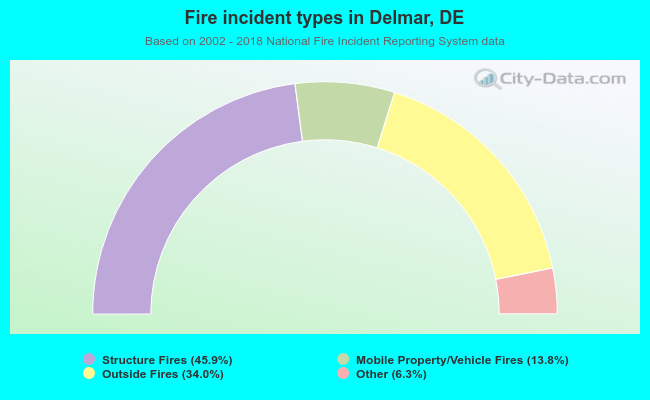 When looking into fire subcategories, the most incidents belonged to: Structure Fires (45.9%), and Outside Fires (34.0%).