Frankford: Fire Incidents, Delaware (DE)
Where are fire incidents reported in Frankford, DE
Something went wrong! Please refresh the page.
|
| |||||||||||||||||||||||||||||||||||||||||||||||||||||||||||||||||||||||||||||||||||||||||||||||||||||||||||||
| Other | 279 | |||||||||||||||||||||||||||||||||||||||||||||||||||||||||||||||||||||||||||||||||||||||||||||||||||||||||||||
2002 - 2018 National Fire Incident Reporting System (NFIRS) incidents
- Incident types reported to NFIRS in Frankford, DE
- 77937.7%Fire
- 69233.5%Rescue & EMS
- 28013.6%Hazardous Condition
- 1165.6%Service Call
- 1155.6%False Alarm
- 733.5%Good Intent Call
- 70.3%Special Incident
- Fire incident types reported to NFIRS in Frankford, DE
- 40652.1%Structure Fires
- 26233.6%Outside Fires
- 8110.4%Mobile Property/Vehicle Fires
- 303.9%Other
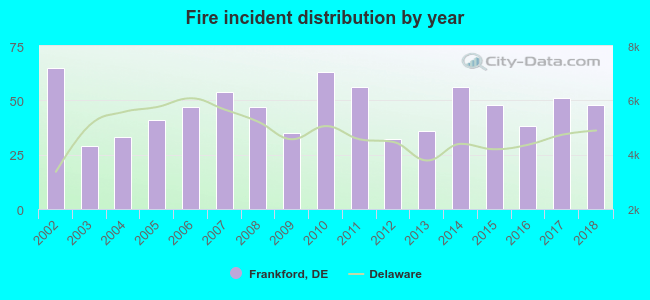 According to the data from the years 2002 - 2018 the average number of fire incidents per year is 46. The highest number of fire incidents - 65 took place in 2002, and the least - 29 in 2003. The data has a dropping trend.
 The median response time based on all reported fire incidents is 8 minutes. This is close to the state median value.
The median response time in Frankford, DE compared to nearest cities:
(Note: Based on data for all years, including only cities with at least 500 fire incidents)
| Frankford: | 8 minutes |
| Dagsboro: | 9 minutes |
| Millsboro: | 9 minutes |
| Bethany Beach: | 7 minutes |
| Georgetown: | 9 minutes |
| Rehoboth Beach: | 6 minutes |
| Laurel: | 10 minutes |
| Lewes: | 8 minutes |
| Delmar: | 9 minutes |
 31.5% incidents where reported in the morning and 68.5% in the evening. The most fires (17.1%) took place on Saturday, and the least (12.7%) on Tuesday.
 Based on the 779 fire incidents from years 2002 - 2018 most fires (10.7%) took place during April, and the least (5.3%) in September.
 Out of all 2,066 cases reported during the years 2002 - 2018, the most belonged to the categories: Fire (37.7%), Rescue & EMS (33.5%), and Hazardous Condition (13.6%).
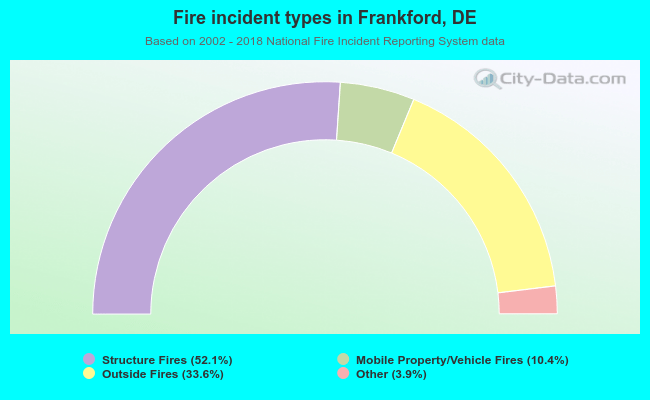 When looking into fire subcategories, the most reports belonged to: Structure Fires (52.1%), and Outside Fires (33.6%).