Brenham: Fire Incidents, Texas (TX)
Where are fire incidents reported in Brenham, TX
Something went wrong! Please refresh the page.
| Fire incidents reported | |
|---|---|
| Sreet name | Count |
| 290 | 148 |
| 36 | 68 |
| OLD CHAPPELL HILL RD | 64 |
| 290 HWY | 58 |
| MARKET ST | 58 |
| PARK ST | 50 |
| BLUE BELL RD | 36 |
| OLD INDEPENDENCE RD | 36 |
| 36 HWY | 32 |
| COLLEGE AVE | 30 |
| 105 HWY | 28 |
| MAIN ST | 28 |
| MARKET | 28 |
| 105 | 24 |
| AUSTIN ST | 24 |
| CHAPPELL HILL ST | 24 |
| RIGGS | 24 |
| ALAMO ST | 22 |
| BERLIN RD | 20 |
| DAY ST | 20 |
| RIGGS ST | 20 |
| HWY 105 | 18 |
| STONE ST | 18 |
| US HIGHWAY 290 | 18 |
| FARMERS RD | 16 |
| FM 50 | 16 |
| LOUNGE RD | 16 |
| OLD MILL CREEK RD | 16 |
| 109 | 14 |
| ALLEN RD | 14 |
| Other | 523 |
2002 - 2018 National Fire Incident Reporting System (NFIRS) incidents
- Incident types reported to NFIRS in Brenham, TX
- 1,51127.7%Fire
- 1,27923.5%Hazardous Condition
- 1,06319.5%Good Intent Call
- 83215.3%False Alarm
- 4608.4%Service Call
- 2374.4%Rescue & EMS
- 260.5%Overpressure Rupture
- 220.4%Special Incident
- 180.3%Severe Weather
- Fire incident types reported to NFIRS in Brenham, TX
- 73948.9%Outside Fires
- 45730.2%Structure Fires
- 23815.8%Mobile Property/Vehicle Fires
- 775.1%Other
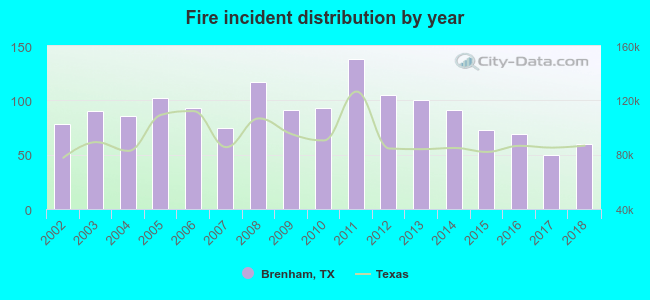 Based on the data from the years 2002 - 2018 the average number of fires per year is 89. The highest number of fires - 138 took place in 2011, and the least - 50 in 2017. The data has a dropping trend.
The average number of yearly fire incidents per 10k residents in Brenham, TX compared to nearest cities:
(Note: Based on data for the last 3 years, including only cities with population 5,000 and above)
| Brenham: | 36.6 |
| Hempstead: | 15.4 |
| Navasota: | 165.5 |
| Prairie View: | 22.1 |
| Sealy: | 140.0 |
| College Station: | 25.1 |
| Giddings: | 130.9 |
| Bryan: | 38.2 |
| Katy: | 260.2 |
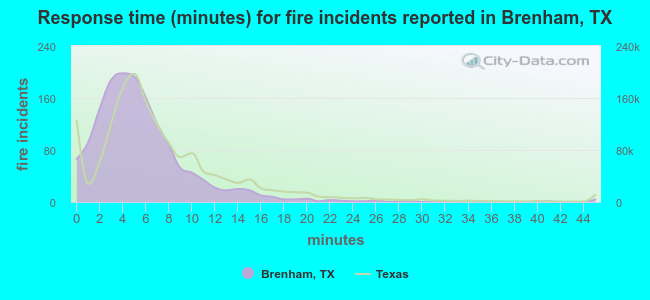 The median response time based on all reported fire incidents is 5 minutes. This is lower compared to the Texas median value.
The median response time in Brenham, TX compared to nearest cities:
(Note: Based on data for all years, including only cities with at least 500 fire incidents)
| Brenham: | 5 minutes |
| Bellville: | 8 minutes |
| Navasota: | 7 minutes |
| Waller: | 10 minutes |
| Sealy: | 8 minutes |
| College Station: | 6 minutes |
| Caldwell: | 12 minutes |
| Giddings: | 5 minutes |
| Columbus: | 9 minutes |
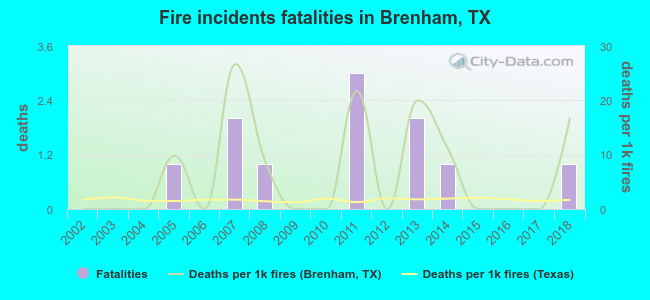 Based on the data from the years 2002 - 2018 the average number of fire-related yearly deaths is 1. The highest number of deaths - 3 took place in 2011, and the lowest - 0 in 2002. The data has a growing trend.
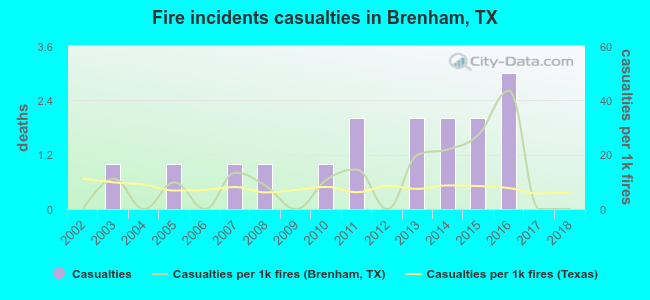 Based on the reports from the years 2002 - 2018 the average number of fire-related casualties per year is 1. The highest number of casualties - 3 took place in 2016, and the lowest - 0 in 2002. The data has a constant trend.
The average number of casualties per 1,000 fire incidents is 11. This indicator was the highest - 43 in 2016, and the lowest 0 in 2002. The trend for injuries per 1,000 incidents is constant. Compared to the Texas value the number of injuries per 1,000 fires is higher.
Based on the reports from the years 2002 - 2018 the average number of fire-related casualties per year is 1. The highest number of casualties - 3 took place in 2016, and the lowest - 0 in 2002. The data has a constant trend.
The average number of casualties per 1,000 fire incidents is 11. This indicator was the highest - 43 in 2016, and the lowest 0 in 2002. The trend for injuries per 1,000 incidents is constant. Compared to the Texas value the number of injuries per 1,000 fires is higher.
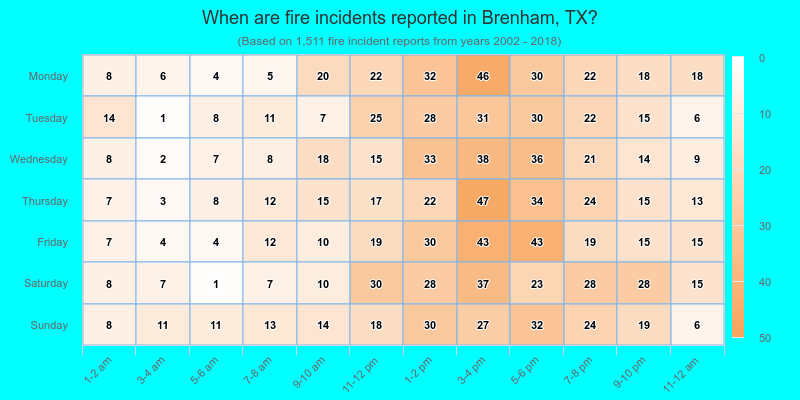
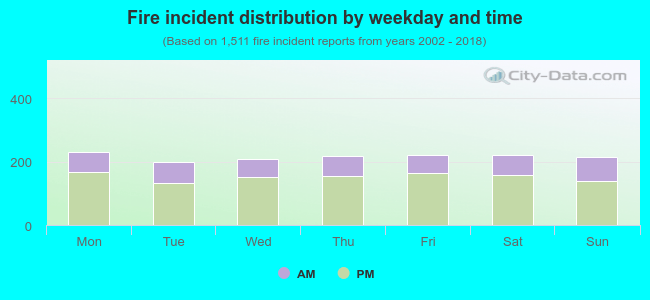 29.5% incidents where reported in the morning and 70.5% in the evening. The most fires (15.3%) took place on Monday, and the least (13.1%) on Tuesday.
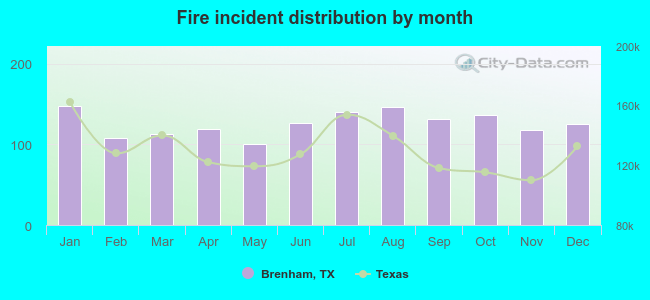 According to the 1,511 fire incidents from years 2002 - 2018 most fires (9.8%) took place during January, and the least (6.7%) in May.
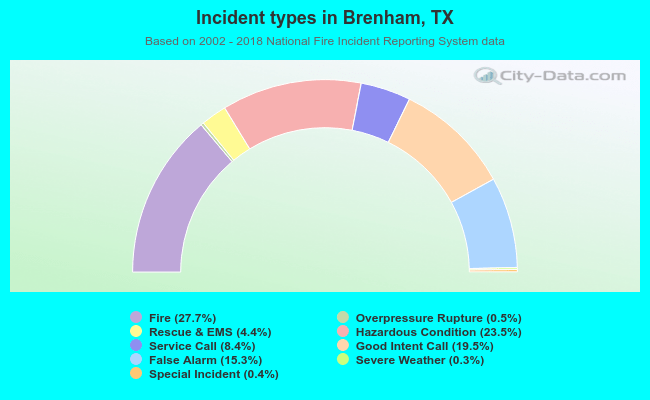 Out of all 5,448 cases reported during the years 2002 - 2018, the most belonged to the categories: Fire (27.7%), Hazardous Condition (23.5%), and Good Intent Call (19.5%).
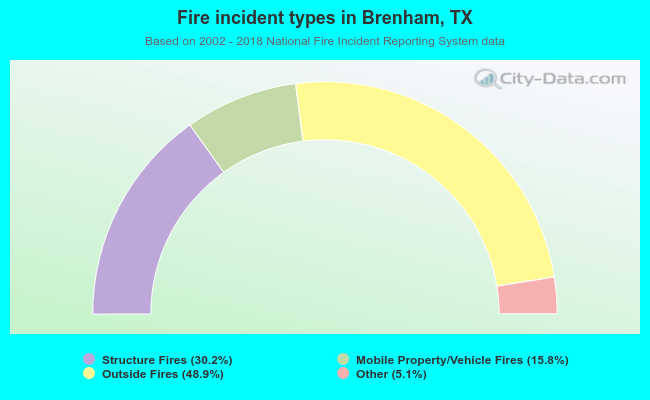 When looking into fire subcategories, the most incidents belonged to: Outside Fires (48.9%), and Structure Fires (30.2%).