College Station: Fire Incidents, Texas (TX)
Where are fire incidents reported in College Station, TX
Something went wrong! Please refresh the page.
| Fire incidents reported | |
|---|---|
| Sreet name | Count |
| UNIVERSITY DR | 250 |
| STATE HIGHWAY 6 | 224 |
| HOLLEMAN DR | 220 |
| HARVEY RD | 206 |
| TEXAS | 184 |
| HARVEY MITCHELL PKY | 168 |
| SH 6 | 160 |
| ROCK PRAIRIE RD | 150 |
| LUTHER ST | 140 |
| FM 2154 | 134 |
| HARVEY | 134 |
| EARL RUDDER FWY | 116 |
| DARTMOUTH ST | 108 |
| HARVEY MITCHELL PW | 104 |
| SOUTHWEST PKY | 104 |
| DOWLING RD | 98 |
| LONGMIRE DR | 98 |
| PARKWAY | 98 |
| EARL RUDDER FW | 94 |
| TEXAS AVE | 92 |
| GEORGE BUSH DR | 82 |
| MARION PUGH DR | 82 |
| CENTRAL PARK LN | 74 |
| ANDERSON ST | 62 |
| GREENS PRAIRIE RD | 60 |
| NAGLE ST | 50 |
| RAYMOND STOTZER PKY | 50 |
| WELLBORN RD | 50 |
| DOMINIK DR | 48 |
| RAYMOND STOTZER PW | 44 |
| Other | 735 |
2002 - 2018 National Fire Incident Reporting System (NFIRS) incidents
- Incident types reported to NFIRS in College Station, TX
- 26,30055.3%Rescue & EMS
- 5,80612.2%Hazardous Condition
- 4,5099.5%False Alarm
- 4,2198.9%Fire
- 4,0708.6%Good Intent Call
- 2,4855.2%Service Call
- 980.2%Overpressure Rupture
- Fire incident types reported to NFIRS in College Station, TX
- 1,82543.3%Outside Fires
- 1,46734.8%Structure Fires
- 70016.6%Mobile Property/Vehicle Fires
- 2275.4%Other
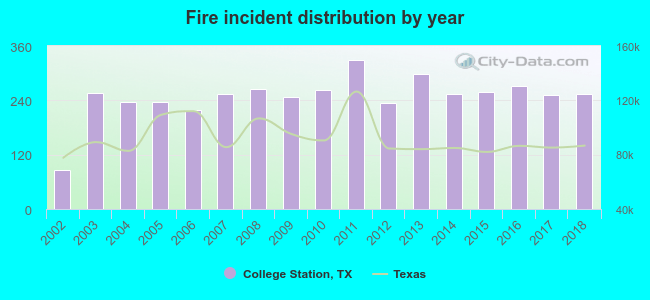 According to the data from the years 2002 - 2018 the average number of fires per year is 248. The highest number of fire incidents - 329 took place in 2011, and the least - 86 in 2002. The data has a rising trend.
The average number of yearly fire incidents per 10k residents in College Station, TX compared to nearest cities:
(Note: Based on data for the last 3 years, including only cities with population 5,000 and above)
| College Station: | 25.1 |
| Bryan: | 38.2 |
| Navasota: | 165.5 |
| Brenham: | 36.6 |
| Hempstead: | 15.4 |
| Prairie View: | 22.1 |
| Rockdale: | 49.8 |
| Cameron: | 87.7 |
| Huntsville: | 57.7 |
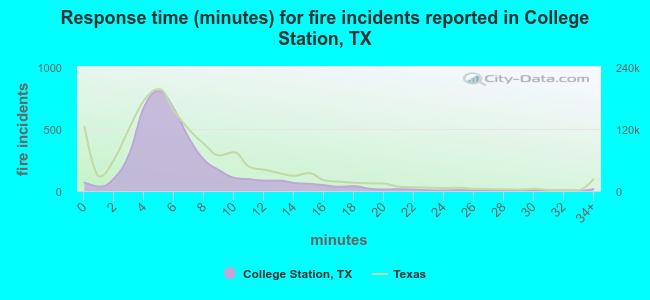 The median response time based on all reported fire incidents is 6 minutes. This is close to the state median value.
The median response time in College Station, TX compared to nearest cities:
(Note: Based on data for all years, including only cities with at least 500 fire incidents)
| College Station: | 6 minutes |
| Bryan: | 6 minutes |
| Navasota: | 7 minutes |
| Caldwell: | 12 minutes |
| Hearne: | 4 minutes |
| Brenham: | 5 minutes |
| Montgomery: | 8 minutes |
| Rockdale: | 9 minutes |
| Magnolia: | 9 minutes |
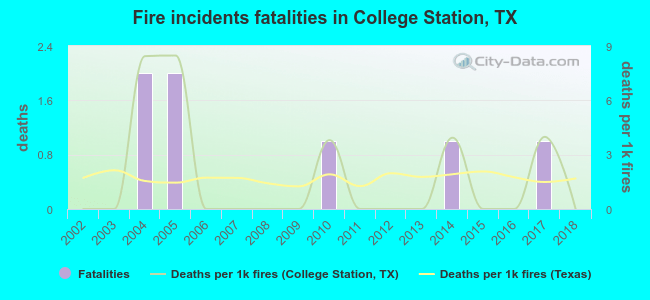 According to the data from the years 2002 - 2018 the average number of fire-related yearly deaths is 0. The highest number of reported deaths - 2 took place in 2004, and the lowest - 0 in 2002. The data has a constant trend.
The average number of fatalities per 1,000 fires is 2. This indicator was the highest - 8 in 2005, and the lowest 0 in 2002. The trend for fatalities per 1,000 fire incidents is constant. Compared to the Texas value the number of deaths per 1,000 fire incidents is about the same.
According to the data from the years 2002 - 2018 the average number of fire-related yearly deaths is 0. The highest number of reported deaths - 2 took place in 2004, and the lowest - 0 in 2002. The data has a constant trend.
The average number of fatalities per 1,000 fires is 2. This indicator was the highest - 8 in 2005, and the lowest 0 in 2002. The trend for fatalities per 1,000 fire incidents is constant. Compared to the Texas value the number of deaths per 1,000 fire incidents is about the same.Deaths per 1,000 incidents in College Station, TX compared to nearest cities:
(Note: Based on data for all years, including only cities with at least 2,500 fire incidents)
| College Station: | 1.7 |
| Bryan: | 1.4 |
| Montgomery: | 1.5 |
| Magnolia: | 1.4 |
| Huntsville: | 0.8 |
| Willis: | 1.6 |
| Tomball: | 3.3 |
| Conroe: | 2.9 |
| The Woodlands: | 1.1 |
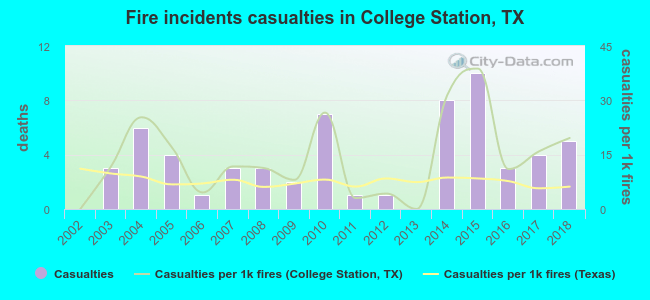 According to the reports from the years 2002 - 2018 the average number of fire-related casualties per year is 4. The highest number of injuries - 10 took place in 2015, and the lowest - 0 in 2002. The data has a rising trend.
The average number of casualties per 1,000 fire incidents is 14. This indicator was the highest - 39 in 2015, and the lowest 0 in 2002. The trend for injuries per 1,000 fires is growing. Compared to the Texas value the number of casualties per 1,000 fire incidents is higher.
According to the reports from the years 2002 - 2018 the average number of fire-related casualties per year is 4. The highest number of injuries - 10 took place in 2015, and the lowest - 0 in 2002. The data has a rising trend.
The average number of casualties per 1,000 fire incidents is 14. This indicator was the highest - 39 in 2015, and the lowest 0 in 2002. The trend for injuries per 1,000 fires is growing. Compared to the Texas value the number of casualties per 1,000 fire incidents is higher.
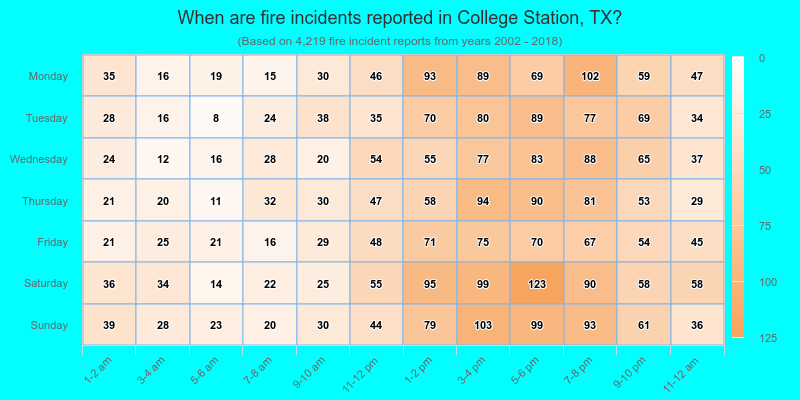
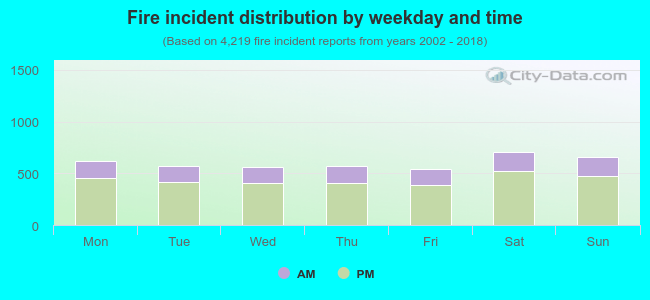 27.4% incidents where reported in the morning and 72.6% in the evening. The most fires (16.8%) took place on Saturday, and the least (12.8%) on Friday.
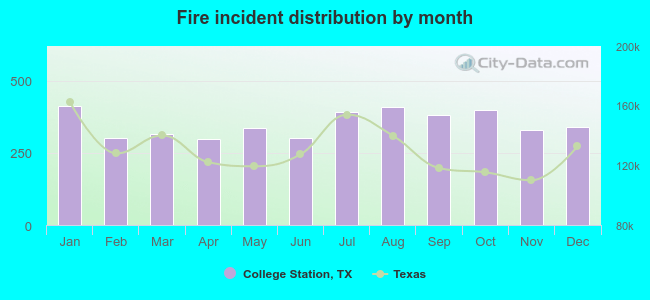 According to the 4,219 reports from years 2002 - 2018 most fires (9.8%) took place during January, and the least (7.1%) in April.
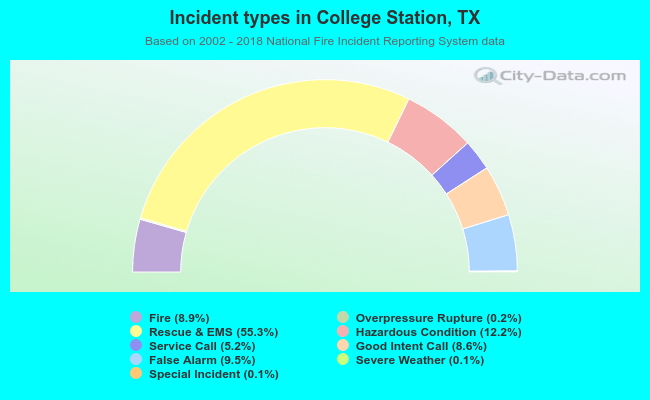 Out of all 47,549 cases reported during the years 2002 - 2018, the most belonged to the categories: Rescue & EMS (55.3%), Hazardous Condition (12.2%), and False Alarm (9.5%).
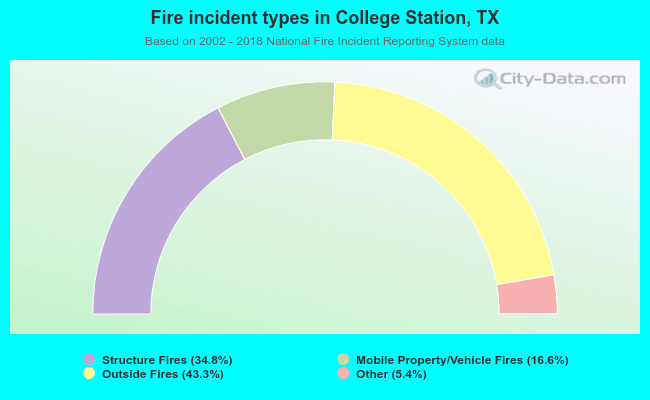 When looking into fire subcategories, the most reports belonged to: Outside Fires (43.3%), and Structure Fires (34.8%).