Columbus: Fire Incidents, Texas (TX)
Where are fire incidents reported in Columbus, TX
Something went wrong! Please refresh the page.
|
| |||||||||||||||||||||||||||||||||||||||||||||||||||||||||||||||||||||||||||||||||||||||||||||||||||||||||||||
| Other | 199 | |||||||||||||||||||||||||||||||||||||||||||||||||||||||||||||||||||||||||||||||||||||||||||||||||||||||||||||
2002 - 2018 National Fire Incident Reporting System (NFIRS) incidents
- Incident types reported to NFIRS in Columbus, TX
- 96757.6%Fire
- 23614.0%Hazardous Condition
- 21412.7%Service Call
- 1066.3%Good Intent Call
- 915.4%Rescue & EMS
- 613.6%False Alarm
- 20.1%Overpressure Rupture
- 20.1%Special Incident
- Fire incident types reported to NFIRS in Columbus, TX
- 60262.3%Outside Fires
- 19720.4%Mobile Property/Vehicle Fires
- 15415.9%Structure Fires
- 141.4%Other
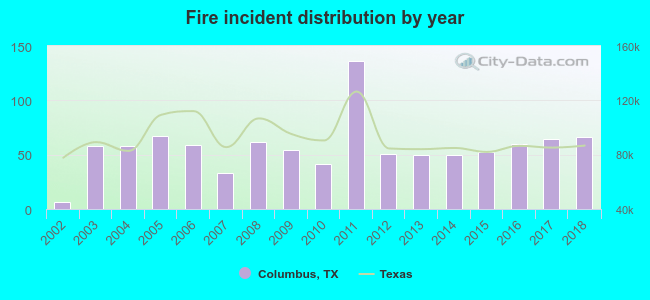 Based on the data from the years 2002 - 2018 the average number of fires per year is 57. The highest number of reported fire incidents - 136 took place in 2011, and the least - 6 in 2002. The data has an increasing trend.
 The median response time based on all reported fire incidents is 9 minutes. This is higher than the Texas median value.
The median response time in Columbus, TX compared to nearest cities:
(Note: Based on data for all years, including only cities with at least 500 fire incidents)
| Columbus: | 9 minutes |
| Schulenburg: | 7 minutes |
| Sealy: | 8 minutes |
| Bellville: | 8 minutes |
| La Grange: | 10 minutes |
| Hallettsville: | 11 minutes |
| Brenham: | 5 minutes |
| Flatonia: | 0 minutes |
| Brookshire: | 9 minutes |
 27.0% incidents where reported in the morning and 73.0% in the evening. The most fires (15.9%) took place on Thursday, and the least (13.0%) on Wednesday.
 Based on the 967 fire incident reports from years 2002 - 2018 most fires (13.7%) took place during September, and the least (5.9%) in March.
 Out of all 1,680 cases reported during the years 2002 - 2018, the most belonged to the categories: Fire (57.6%), Hazardous Condition (14.0%), and Service Call (12.7%).
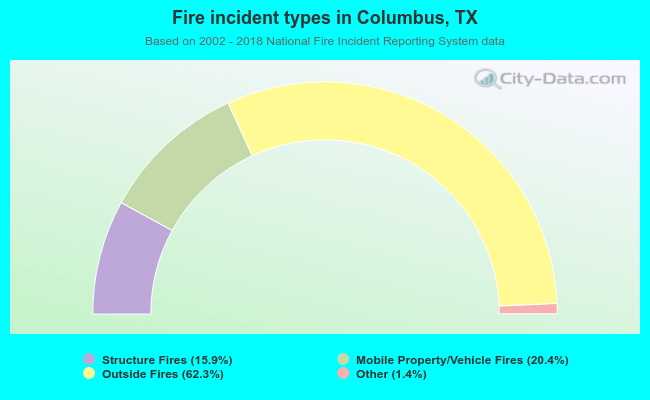 When looking into fire subcategories, the most reports belonged to: Outside Fires (62.3%), and Mobile Property/Vehicle Fires (20.4%).