Bellville: Fire Incidents, Texas (TX)
Where are fire incidents reported in Bellville, TX
Something went wrong! Please refresh the page.
|
| |||||||||||||||||||||||||||||||||||||||||||||||||||||||||||||||||||||||||||||||||||||||||||||||||||||||||||||
| Other | 108 | |||||||||||||||||||||||||||||||||||||||||||||||||||||||||||||||||||||||||||||||||||||||||||||||||||||||||||||
2003 - 2018 National Fire Incident Reporting System (NFIRS) incidents
- Incident types reported to NFIRS in Bellville, TX
- 69727.8%Rescue & EMS
- 69027.5%Fire
- 58123.2%Hazardous Condition
- 25910.3%Good Intent Call
- 1415.6%False Alarm
- 1285.1%Service Call
- 70.3%Overpressure Rupture
- 60.2%Severe Weather
- Fire incident types reported to NFIRS in Bellville, TX
- 46667.5%Outside Fires
- 15622.6%Structure Fires
- 588.4%Mobile Property/Vehicle Fires
- 101.4%Other
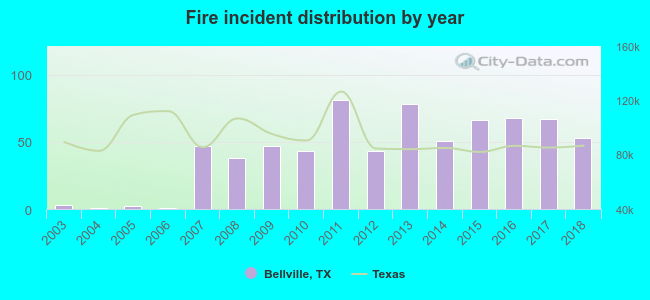 According to the data from the years 2003 - 2018 the average number of fires per year is 43. The highest number of fire incidents - 81 took place in 2011, and the least - 1 in 2004. The data has a rising trend.
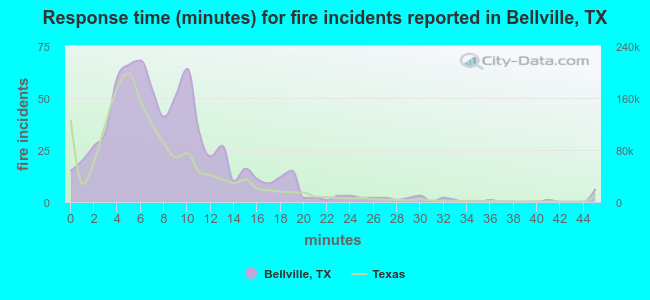 The median response time based on all reported fire incidents is 8 minutes. This is higher compared to the Texas median value.
The median response time in Bellville, TX compared to nearest cities:
(Note: Based on data for all years, including only cities with at least 500 fire incidents)
| Bellville: | 8 minutes |
| Sealy: | 8 minutes |
| Brenham: | 5 minutes |
| Waller: | 10 minutes |
| Brookshire: | 9 minutes |
| Columbus: | 9 minutes |
| Katy: | 8 minutes |
| Fulshear: | 9 minutes |
| Navasota: | 7 minutes |
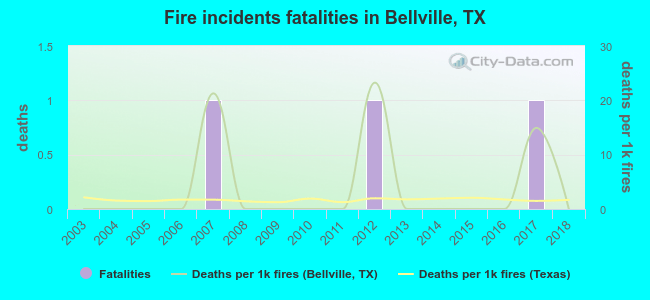 Based on the reports from the years 2003 - 2018 the average number of fire-related fatalities per year is 0. The highest number of reported deaths - 1 took place in 2007, and the lowest - 0 in 2003. The data has a constant trend.
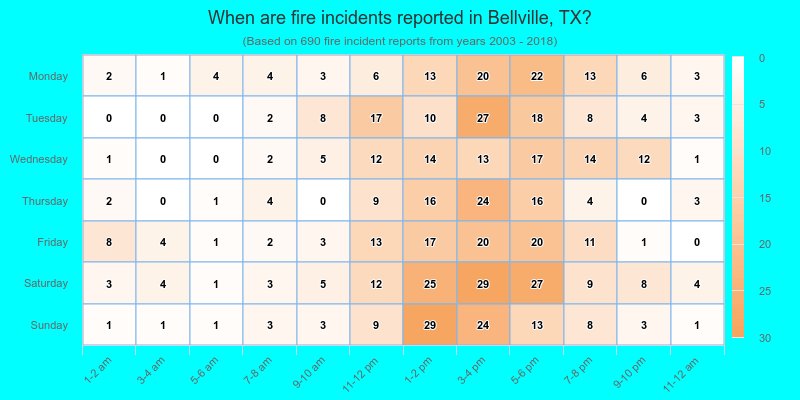
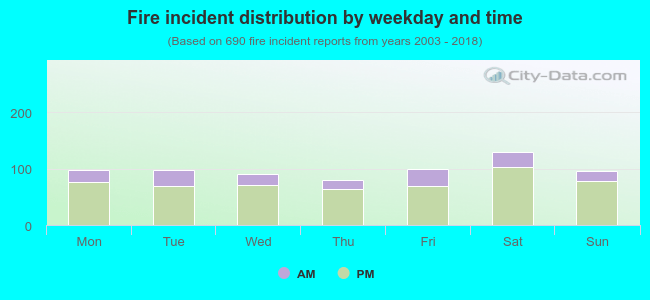 23.2% incidents where reported in the morning and 76.8% in the evening. The most fires (18.8%) took place on Saturday, and the least (11.4%) on Thursday.
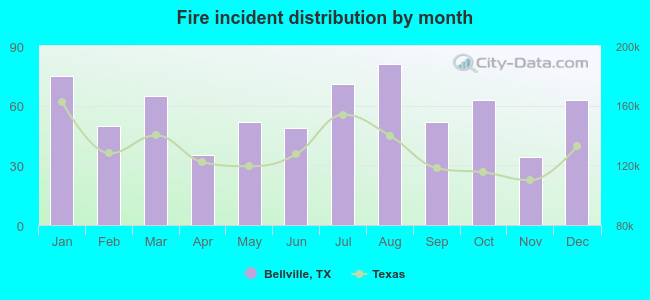 According to the 690 fire incident reports from years 2003 - 2018 most fires (11.7%) took place during August, and the least (4.9%) in November.
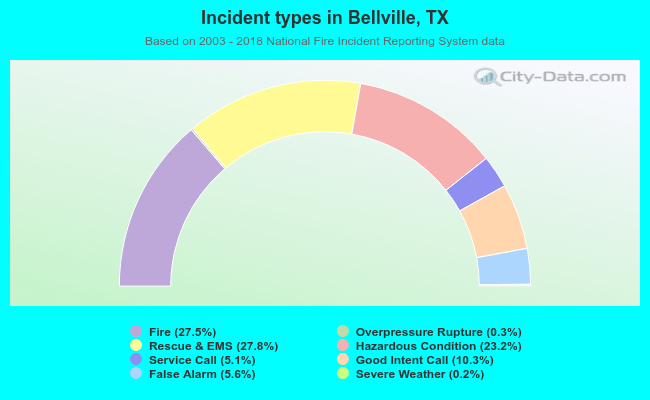 Out of all 2,509 cases reported during the years 2003 - 2018, the most belonged to the categories: Rescue & EMS (27.8%), Fire (27.5%), and Hazardous Condition (23.2%).
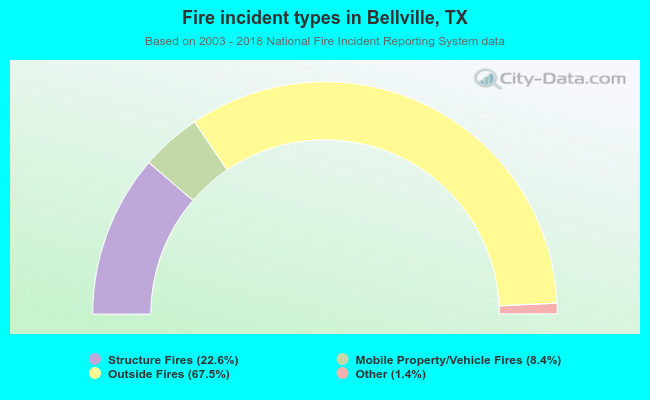 When looking into fire subcategories, the most incidents belonged to: Outside Fires (67.5%), and Structure Fires (22.6%).