Crime rate in Fontana, California (CA): murders, rapes, robberies, assaults, burglaries, thefts, auto thefts, arson, law enforcement employees, police officers, crime map
Crime rate in Fontana, CA
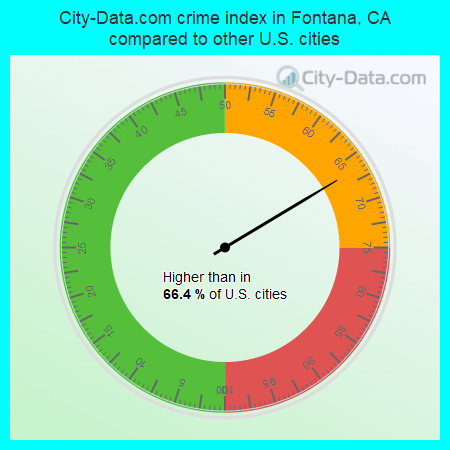
The 2022 crime rate in Fontana, CA is 159 (City-Data.com crime index), which is 1.6 times smaller than the U.S. average. It was higher than in 66.4% U.S. cities. The 2022 Fontana crime rate rose by 261% compared to 2021. In the last 5 years Fontana has seen decreasing violent crime and decreasing property crime.See how dangerous Fontana, CA is compared to the nearest cities:
(Note: Higher means more crime)
(Note: Higher means more crime)
| Fontana: | 158.7 |
| Rialto: | 301.9 |
| Rancho Cucamonga: | 194.1 |
| Colton: | 247.8 |
| Grand Terrace: | 231.2 |
| San Bernardino: | 521.9 |
| Ontario: | 231.3 |
| Riverside: | 318.4 |
| Upland: | 212.2 |
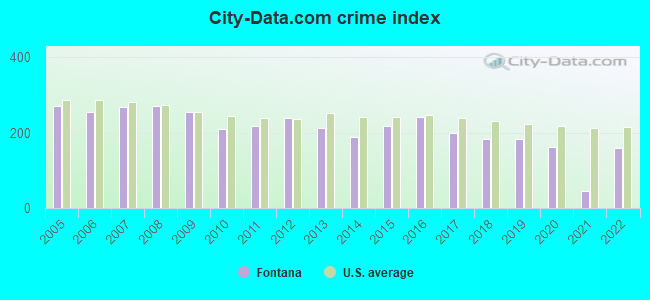
The City-Data.com crime index weighs serious crimes and violent crimes more heavily. Higher means more crime, U.S. average is 246.1. It adjusts for the number of visitors and daily workers commuting into cities.
- means the value is smaller than the state average.- means the value is about the same as the state average.
- means the value is bigger than the state average.
- means the value is much bigger than the state average.
According to our research of California and other state lists, there were 266 registered sex offenders living in Fontana, California as of May 03, 2024.
The ratio of all residents to sex offenders in Fontana is 788 to 1.
The ratio of registered sex offenders to all residents in this city is near the state average.
Violent crime rate in 2022
| Fontana: | 163.4 |
| U.S. Average: | 219.8 |
Violent crime rate in 2021
| Fontana: | 42.9 |
| U.S. Average: | 224.8 |
Violent crime rate in 2020
| Fontana: | 175.7 |
| U.S. Average: | 228.2 |
Violent crime rate in 2019
| Fontana: | 194.5 |
| U.S. Average: | 219.9 |
Violent crime rate in 2018
| Fontana: | 186.0 |
| U.S. Average: | 221.2 |
Violent crime rate in 2017
| Fontana: | 189.6 |
| U.S. Average: | 226.2 |
Violent crime rate in 2016
| Fontana: | 234.1 |
| U.S. Average: | 227.3 |
Violent crime rate in 2015
| Fontana: | 207.5 |
| U.S. Average: | 219.3 |
Violent crime rate in 2014
| Fontana: | 184.6 |
| U.S. Average: | 211.1 |
Violent crime rate in 2013
| Fontana: | 193.7 |
| U.S. Average: | 214.2 |
Violent crime rate in 2012
| Fontana: | 223.0 |
| U.S. Average: | 187.4 |
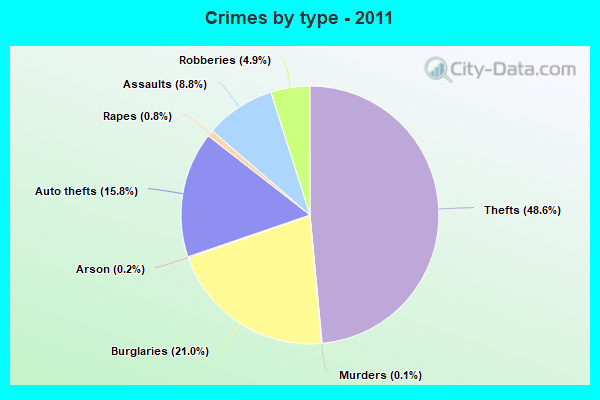
Violent crime rate in 2011
| Fontana: | 195.1 |
| U.S. Average: | 187.1 |
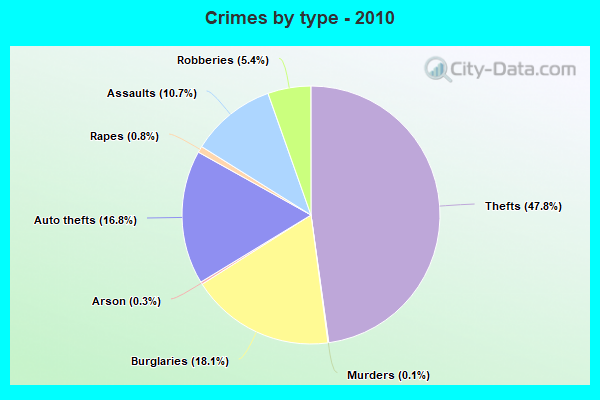
Violent crime rate in 2010
| Fontana: | 207.6 |
| U.S. Average: | 195.7 |
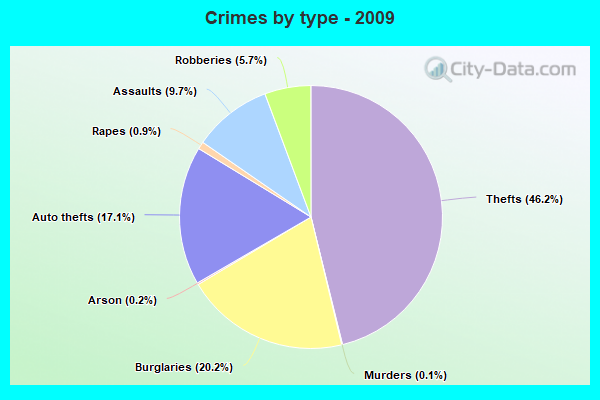
Violent crime rate in 2009
| Fontana: | 242.5 |
| U.S. Average: | 208.9 |
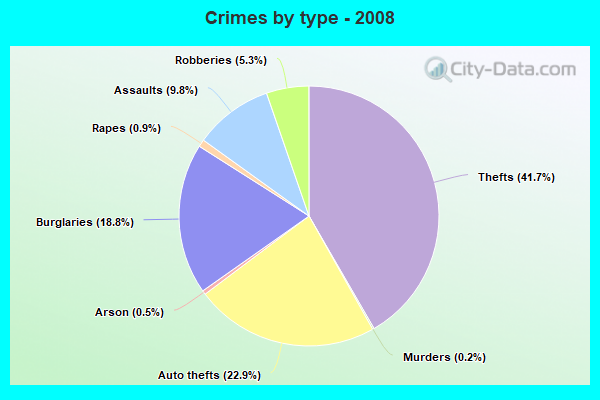
Violent crime rate in 2008
| Fontana: | 251.8 |
| U.S. Average: | 222.5 |
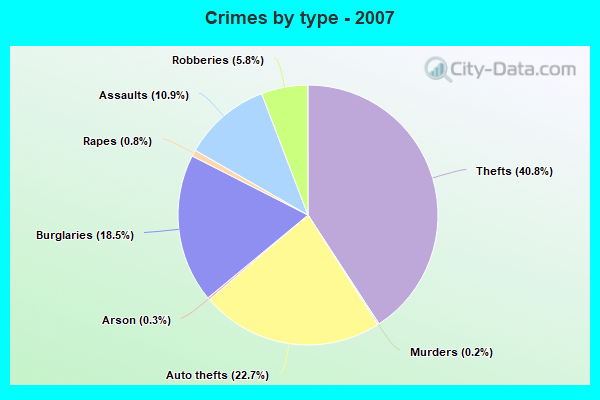
Violent crime rate in 2007
| Fontana: | 264.7 |
| U.S. Average: | 229.1 |
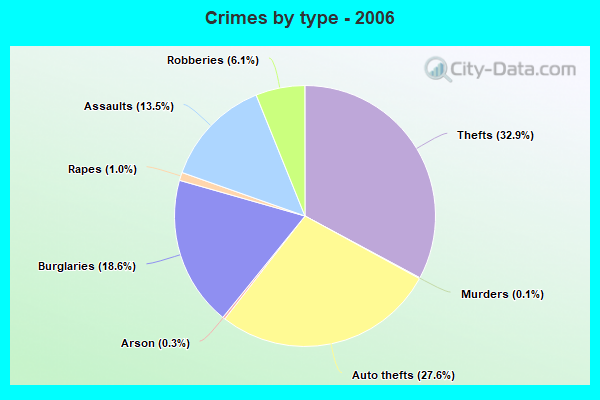
Violent crime rate in 2006
| Fontana: | 269.4 |
| U.S. Average: | 232.6 |
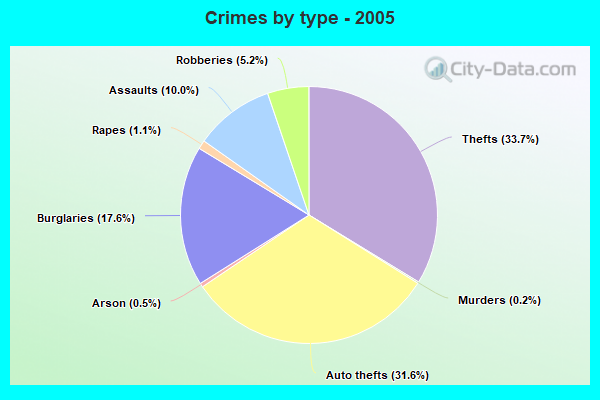
Violent crime rate in 2005
| Fontana: | 247.2 |
| U.S. Average: | 227.0 |
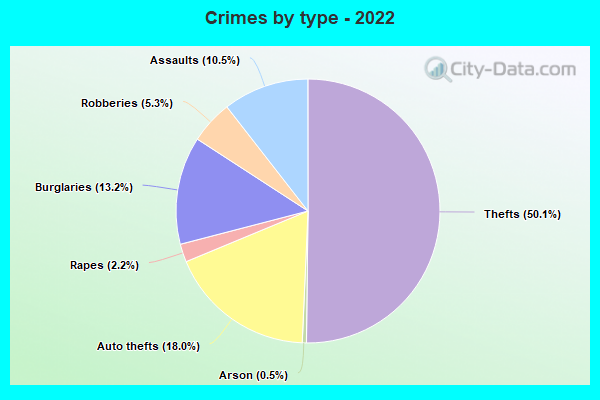
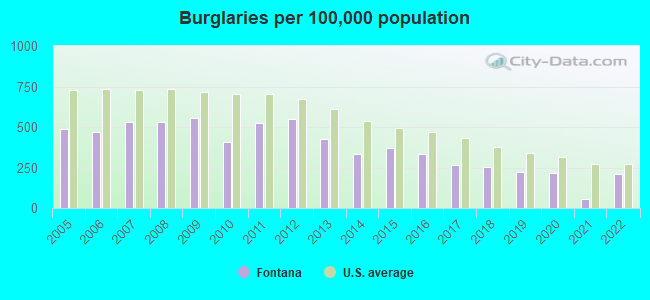
Property crime rate in 2022
| Fontana: | 124.2 |
| U.S. Average: | 166.5 |
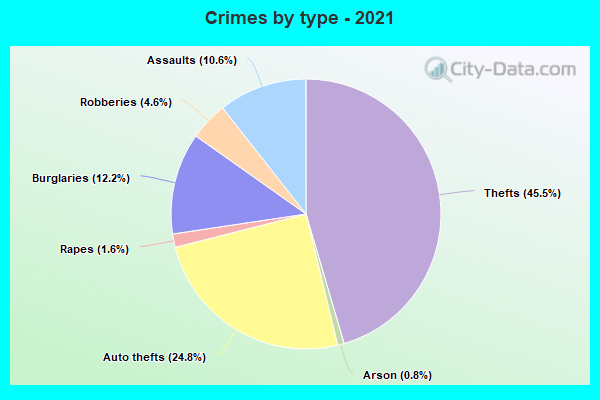
Property crime rate in 2021
| Fontana: | 39.3 |
| U.S. Average: | 157.8 |
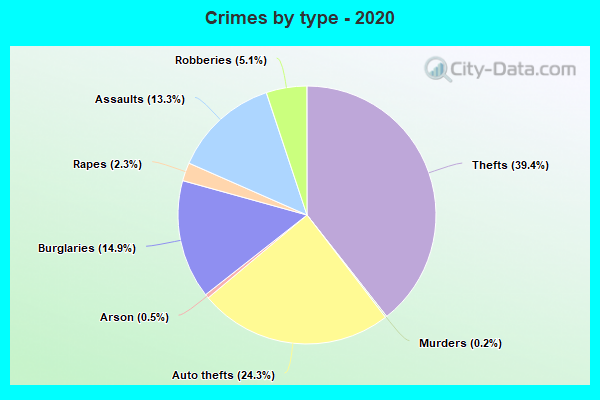
Property crime rate in 2020
| Fontana: | 126.4 |
| U.S. Average: | 169.6 |
Property crime rate in 2019
| Fontana: | 140.7 |
| U.S. Average: | 179.7 |
Property crime rate in 2018
| Fontana: | 155.4 |
| U.S. Average: | 190.2 |
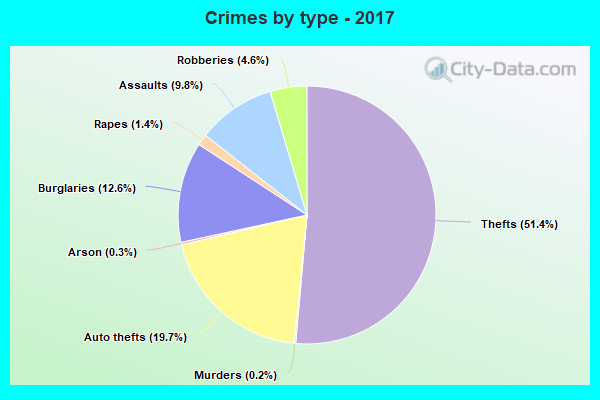
Property crime rate in 2017
| Fontana: | 169.7 |
| U.S. Average: | 206.4 |
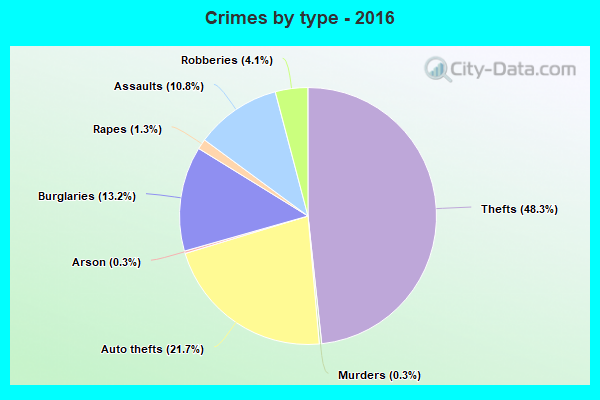
Property crime rate in 2016
| Fontana: | 209.6 |
| U.S. Average: | 216.6 |
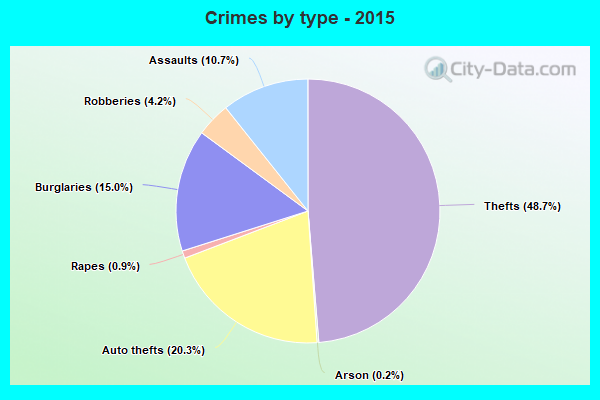
Property crime rate in 2015
| Fontana: | 208.3 |
| U.S. Average: | 221.5 |
Property crime rate in 2014
| Fontana: | 181.7 |
| U.S. Average: | 230.8 |
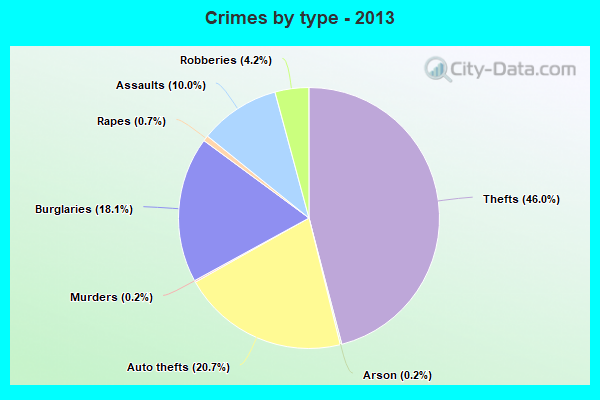
Property crime rate in 2013
| Fontana: | 213.9 |
| U.S. Average: | 250.4 |
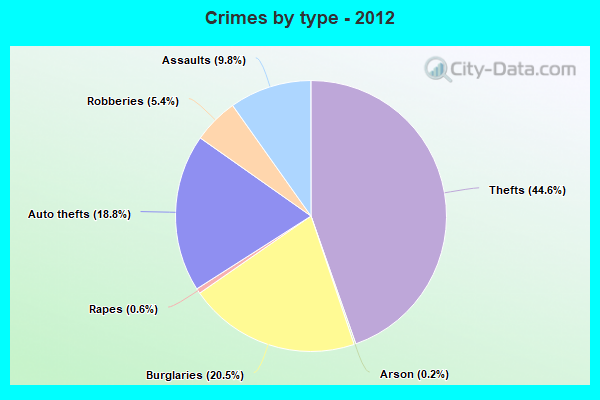
Property crime rate in 2012
| Fontana: | 244.0 |
| U.S. Average: | 267.3 |
Property crime rate in 2011
| Fontana: | 224.9 |
| U.S. Average: | 273.5 |
Property crime rate in 2010
| Fontana: | 193.5 |
| U.S. Average: | 276.4 |
Property crime rate in 2009
| Fontana: | 246.3 |
| U.S. Average: | 285.6 |
Property crime rate in 2008
| Fontana: | 262.6 |
| U.S. Average: | 302.2 |
Property crime rate in 2007
| Fontana: | 254.5 |
| U.S. Average: | 309.2 |
Property crime rate in 2006
| Fontana: | 233.4 |
| U.S. Average: | 317.3 |
Property crime rate in 2005
| Fontana: | 268.2 |
| U.S. Average: | 322.3 |

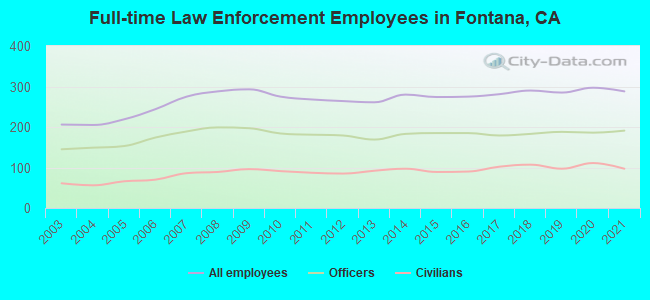
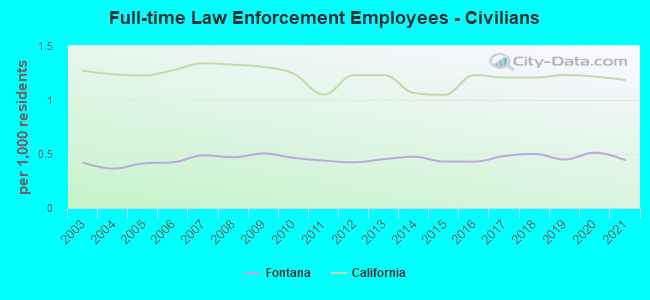
Full-time law enforcement employees in 2021, including police officers: 288 (191 officers - 173 male; 18 female).
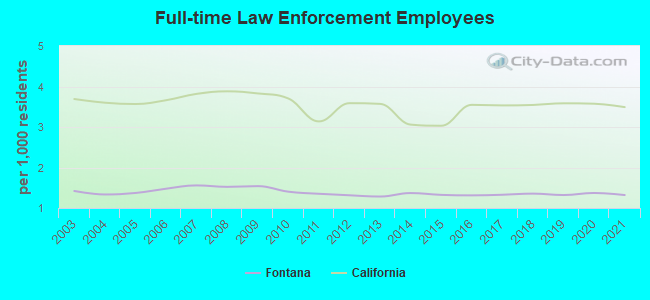
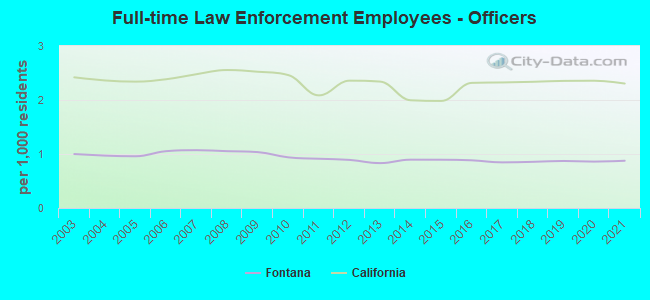
| Officers per 1,000 residents here: | 0.88 |
| California average: | 2.30 |
Full-time law enforcement employees in 2020, including police officers: 297 (186 officers - 170 male; 16 female).
| Officers per 1,000 residents here: | 0.86 |
| California average: | 2.36 |
Full-time law enforcement employees in 2019, including police officers: 285 (188 officers - 173 male; 15 female).
| Officers per 1,000 residents here: | 0.87 |
| California average: | 2.35 |
Full-time law enforcement employees in 2018, including police officers: 290 (183 officers - 171 male; 12 female).
| Officers per 1,000 residents here: | 0.86 |
| California average: | 2.34 |
Full-time law enforcement employees in 2017, including police officers: 281 (179 officers - 164 male; 15 female).
| Officers per 1,000 residents here: | 0.85 |
| California average: | 2.32 |
Full-time law enforcement employees in 2016, including police officers: 275 (185 officers - 169 male; 16 female).
| Officers per 1,000 residents here: | 0.88 |
| California average: | 2.32 |
Full-time law enforcement employees in 2015, including police officers: 274 (185 officers - 168 male; 17 female).
| Officers per 1,000 residents here: | 0.89 |
| California average: | 1.98 |
Full-time law enforcement employees in 2014, including police officers: 280 (183 officers - 165 male; 18 female).
| Officers per 1,000 residents here: | 0.89 |
| California average: | 2.00 |
Full-time law enforcement employees in 2013, including police officers: 261 (169 officers - 151 male; 18 female).
| Officers per 1,000 residents here: | 0.83 |
| California average: | 2.34 |
Full-time law enforcement employees in 2012, including police officers: 264 (179 officers - 160 male; 19 female).
| Officers per 1,000 residents here: | 0.89 |
| California average: | 2.36 |
Full-time law enforcement employees in 2011, including police officers: 268 (181 officers - 164 male; 17 female).
| Officers per 1,000 residents here: | 0.91 |
| California average: | 2.09 |
Full-time law enforcement employees in 2010, including police officers: 275 (184 officers - 167 male; 17 female).
| Officers per 1,000 residents here: | 0.94 |
| California average: | 2.46 |
Full-time law enforcement employees in 2009, including police officers: 293 (197 officers - 178 male; 19 female).
| Officers per 1,000 residents here: | 1.04 |
| California average: | 2.52 |
Full-time law enforcement employees in 2008, including police officers: 288 (199 officers - 181 male; 18 female).
| Officers per 1,000 residents here: | 1.05 |
| California average: | 2.55 |
Full-time law enforcement employees in 2007, including police officers: 275 (189 officers - 170 male; 19 female).
| Officers per 1,000 residents here: | 1.07 |
| California average: | 2.48 |
Full-time law enforcement employees in 2006, including police officers: 244 (174 officers - 157 male; 17 female).
| Officers per 1,000 residents here: | 1.05 |
| California average: | 2.38 |
Full-time law enforcement employees in 2005, including police officers: 219 (153 officers - 137 male; 16 female).
| Officers per 1,000 residents here: | 0.96 |
| California average: | 2.34 |
Full-time law enforcement employees in 2004, including police officers: 205 (149 officers - 132 male; 17 female).
| Officers per 1,000 residents here: | 0.97 |
| California average: | 2.36 |
Full-time law enforcement employees in 2003, including police officers: 206 (145 officers - 129 male; 16 female).
| Officers per 1,000 residents here: | 1.00 |
| California average: | 2.42 |