Crime rate in San Bernardino, California (CA): murders, rapes, robberies, assaults, burglaries, thefts, auto thefts, arson, law enforcement employees, police officers, crime map
Crime rate in San Bernardino, CA
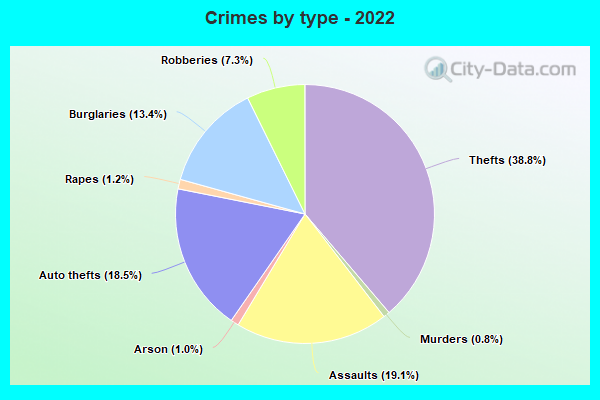
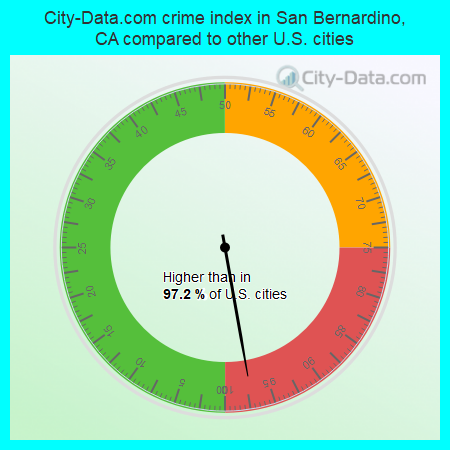
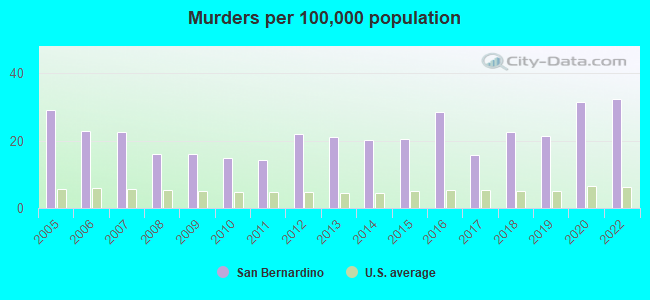
The 2022 crime rate in San Bernardino, CA is 522 (City-Data.com crime index), which is 2.1 times higher than the U.S. average. It was higher than in 97.2% U.S. cities. The 2022 San Bernardino crime rate fell by 8% compared to 2020. The number of homicides stood at 72 - an increase of 4 compared to 2020. In the last 5 years San Bernardino has seen decline of violent crime and decreasing property crime.See how dangerous San Bernardino, CA is compared to the nearest cities:
(Note: Higher means more crime)
(Note: Higher means more crime)
| San Bernardino: | 521.9 |
| Colton: | 247.8 |
| Highland: | 261.9 |
| Rialto: | 301.9 |
| Loma Linda: | 205.5 |
| Grand Terrace: | 231.2 |
| Redlands: | 244.0 |
| Fontana: | 158.7 |
| Riverside: | 318.4 |
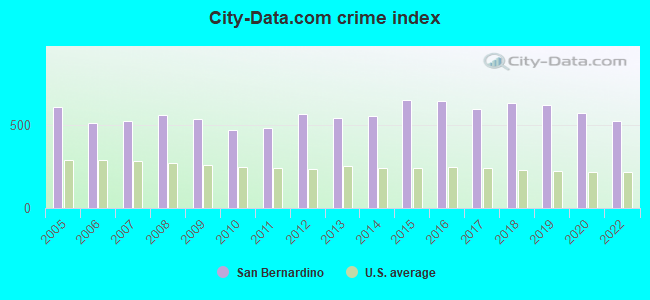
The City-Data.com crime index weighs serious crimes and violent crimes more heavily. Higher means more crime, U.S. average is 246.1. It adjusts for the number of visitors and daily workers commuting into cities.
- means the value is about the same as the state average.- means the value is bigger than the state average.
- means the value is much bigger than the state average.
According to our research of California and other state lists, there were 697 registered sex offenders living in San Bernardino, California as of May 02, 2024.
The ratio of all residents to sex offenders in San Bernardino is 310 to 1.
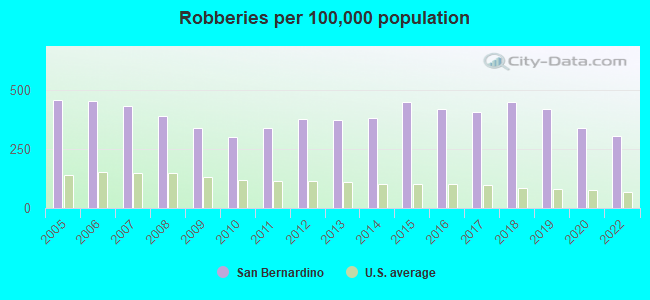
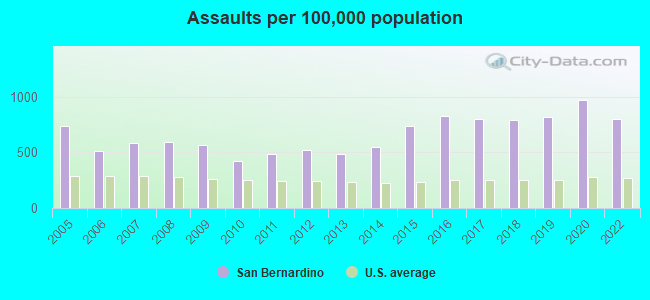
Violent crime rate in 2022
| San Bernardino: | 666.6 |
| U.S. Average: | 219.8 |
Violent crime rate in 2020
| San Bernardino: | 779.0 |
| U.S. Average: | 228.2 |
Violent crime rate in 2019
| San Bernardino: | 723.5 |
| U.S. Average: | 219.9 |
Violent crime rate in 2018
| San Bernardino: | 735.4 |
| U.S. Average: | 221.2 |
Violent crime rate in 2017
| San Bernardino: | 705.4 |
| U.S. Average: | 226.2 |
Violent crime rate in 2016
| San Bernardino: | 733.3 |
| U.S. Average: | 227.3 |
Violent crime rate in 2015
| San Bernardino: | 676.1 |
| U.S. Average: | 219.3 |
Violent crime rate in 2014
| San Bernardino: | 550.1 |
| U.S. Average: | 211.1 |
Violent crime rate in 2013
| San Bernardino: | 503.4 |
| U.S. Average: | 214.2 |
Violent crime rate in 2012
| San Bernardino: | 516.1 |
| U.S. Average: | 187.4 |
Violent crime rate in 2011
| San Bernardino: | 477.4 |
| U.S. Average: | 187.1 |
Violent crime rate in 2010
| San Bernardino: | 424.7 |
| U.S. Average: | 195.7 |
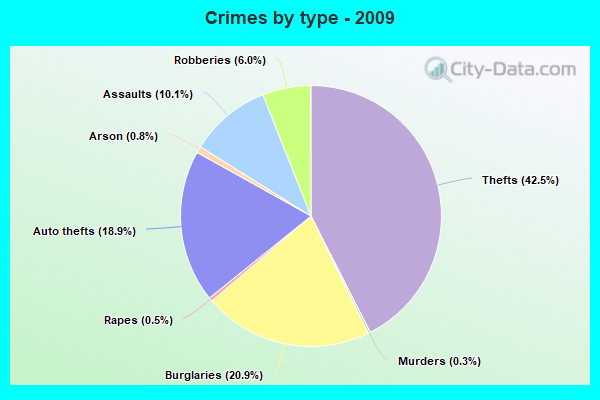
Violent crime rate in 2009
| San Bernardino: | 517.1 |
| U.S. Average: | 208.9 |
Violent crime rate in 2008
| San Bernardino: | 557.0 |
| U.S. Average: | 222.5 |
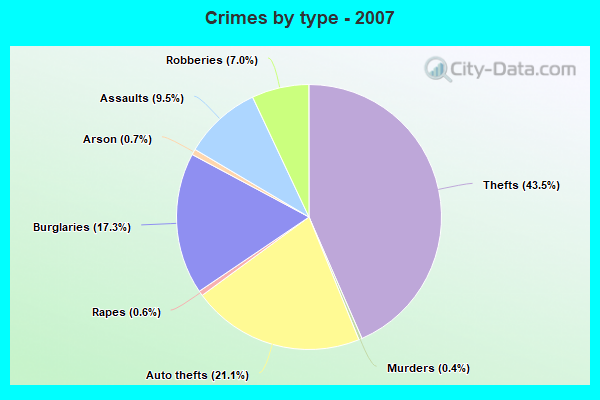
Violent crime rate in 2007
| San Bernardino: | 509.8 |
| U.S. Average: | 229.1 |
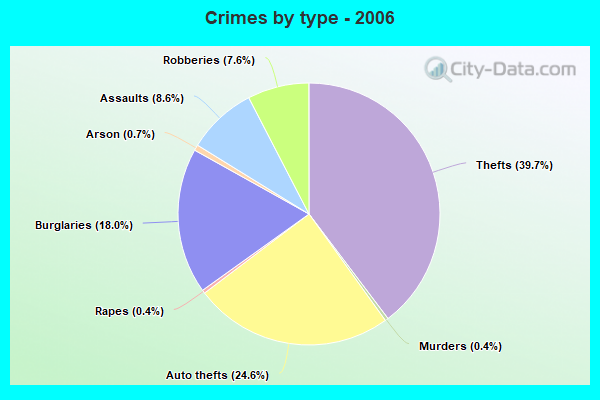
Violent crime rate in 2006
| San Bernardino: | 477.7 |
| U.S. Average: | 232.6 |
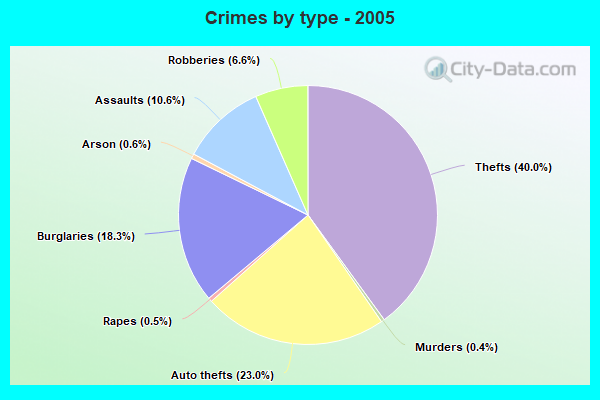
Violent crime rate in 2005
| San Bernardino: | 598.9 |
| U.S. Average: | 227.0 |
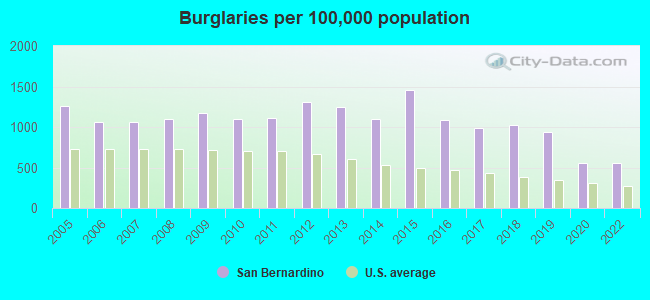
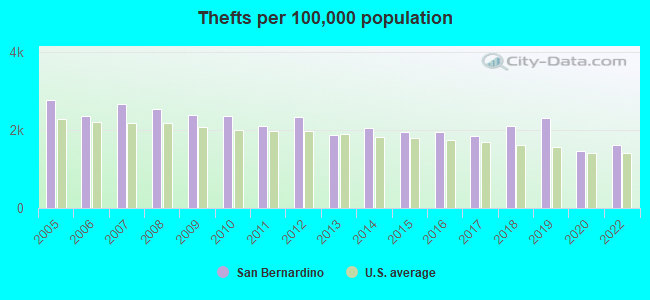
Property crime rate in 2022
| San Bernardino: | 309.1 |
| U.S. Average: | 166.5 |
Property crime rate in 2020
| San Bernardino: | 302.3 |
| U.S. Average: | 169.6 |
Property crime rate in 2019
| San Bernardino: | 445.8 |
| U.S. Average: | 179.7 |
Property crime rate in 2018
| San Bernardino: | 460.6 |
| U.S. Average: | 190.2 |
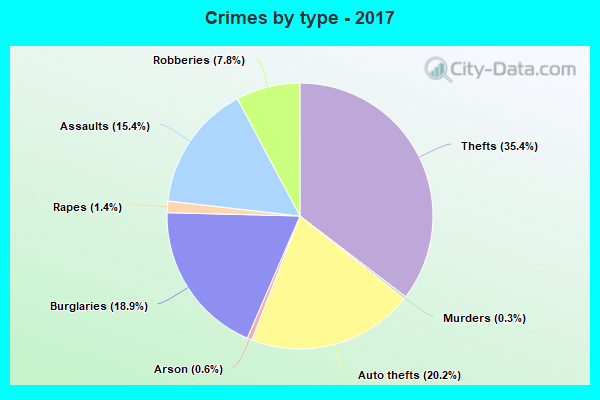
Property crime rate in 2017
| San Bernardino: | 445.7 |
| U.S. Average: | 206.4 |
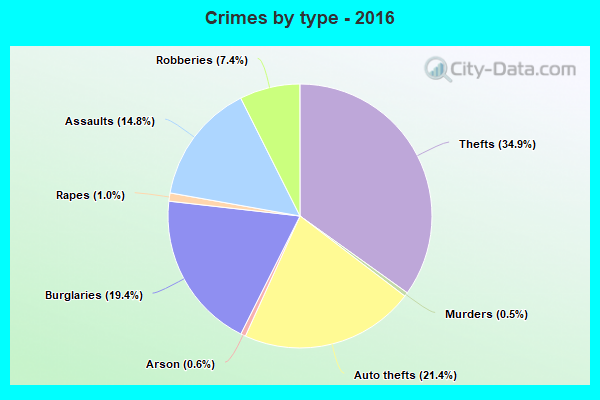
Property crime rate in 2016
| San Bernardino: | 493.1 |
| U.S. Average: | 216.6 |
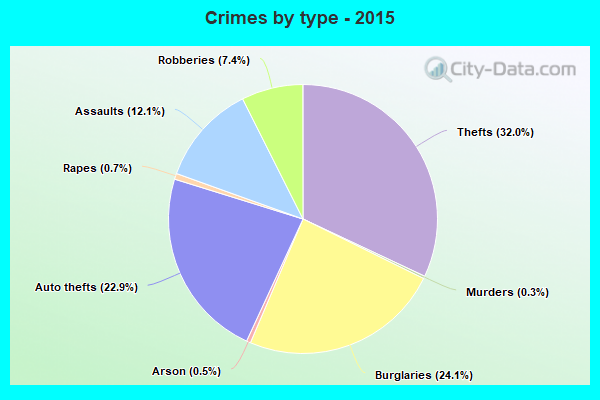
Property crime rate in 2015
| San Bernardino: | 598.5 |
| U.S. Average: | 221.5 |
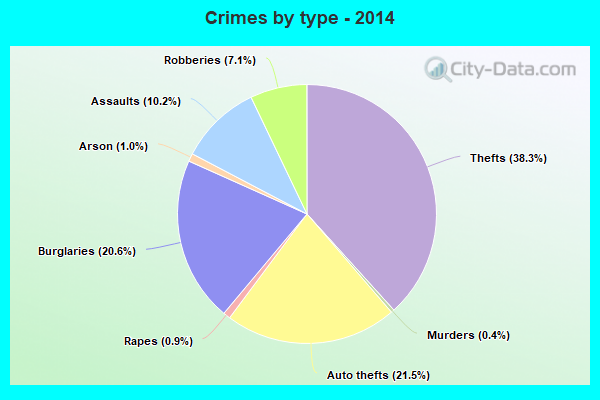
Property crime rate in 2014
| San Bernardino: | 495.8 |
| U.S. Average: | 230.8 |
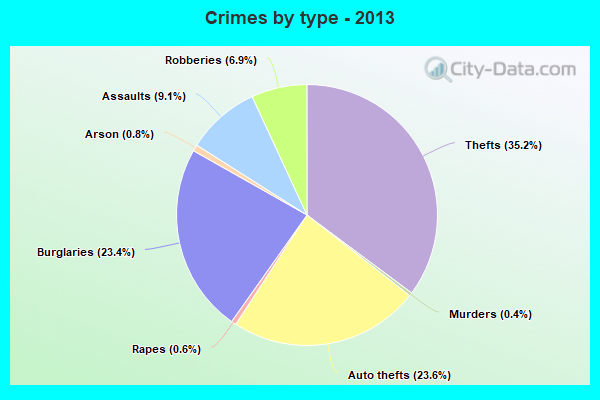
Property crime rate in 2013
| San Bernardino: | 531.7 |
| U.S. Average: | 250.4 |
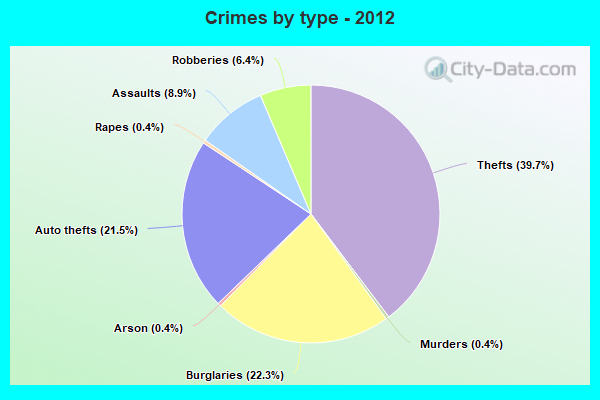
Property crime rate in 2012
| San Bernardino: | 566.5 |
| U.S. Average: | 267.3 |
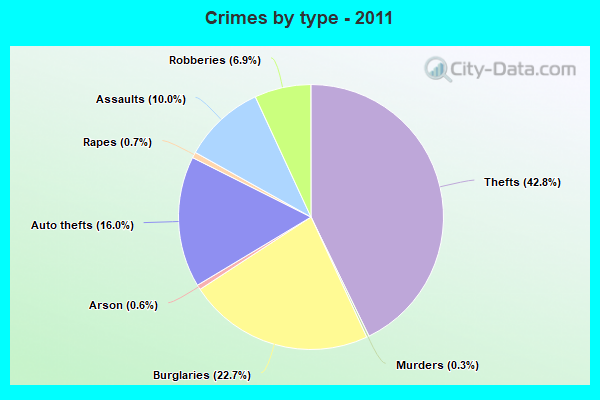
Property crime rate in 2011
| San Bernardino: | 443.8 |
| U.S. Average: | 273.5 |
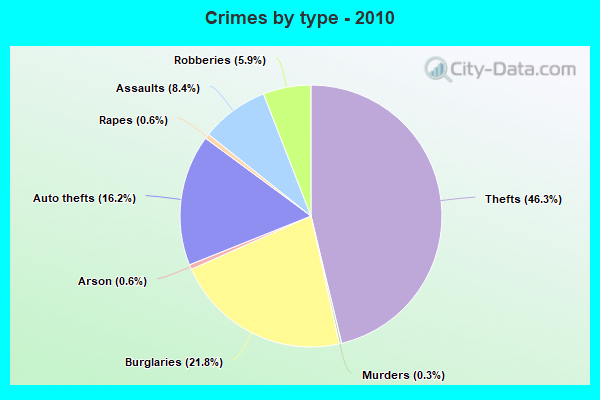
Property crime rate in 2010
| San Bernardino: | 461.2 |
| U.S. Average: | 276.4 |
Property crime rate in 2009
| San Bernardino: | 514.2 |
| U.S. Average: | 285.6 |
Property crime rate in 2008
| San Bernardino: | 508.0 |
| U.S. Average: | 302.2 |
Property crime rate in 2007
| San Bernardino: | 468.6 |
| U.S. Average: | 309.2 |
Property crime rate in 2006
| San Bernardino: | 476.6 |
| U.S. Average: | 317.3 |
Property crime rate in 2005
| San Bernardino: | 546.5 |
| U.S. Average: | 322.3 |
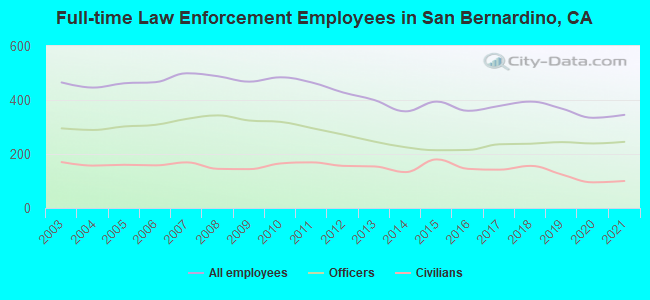
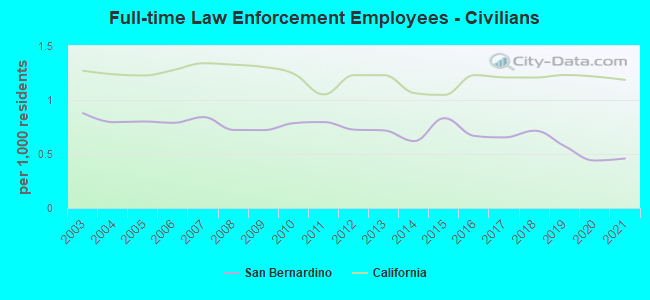
Full-time law enforcement employees in 2021, including police officers: 345 (245 officers - 214 male; 31 female).
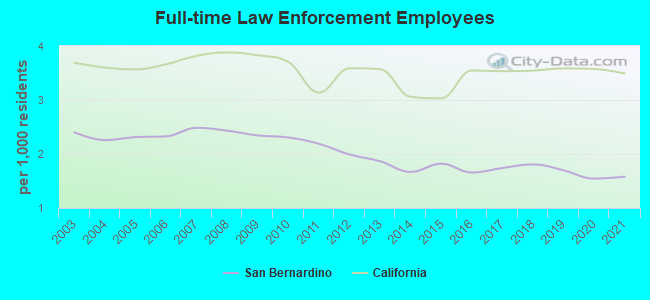
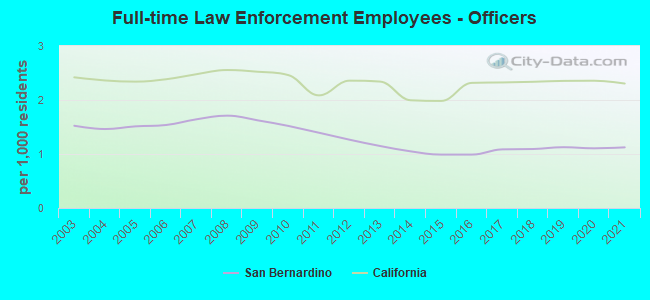
| Officers per 1,000 residents here: | 1.12 |
| California average: | 2.30 |
Full-time law enforcement employees in 2020, including police officers: 334 (239 officers - 210 male; 29 female).
| Officers per 1,000 residents here: | 1.10 |
| California average: | 2.36 |
Full-time law enforcement employees in 2019, including police officers: 368 (244 officers - 217 male; 27 female).
| Officers per 1,000 residents here: | 1.13 |
| California average: | 2.35 |
Full-time law enforcement employees in 2018, including police officers: 394 (238 officers - 215 male; 23 female).
| Officers per 1,000 residents here: | 1.09 |
| California average: | 2.34 |
Full-time law enforcement employees in 2017, including police officers: 378 (236 officers - 214 male; 22 female).
| Officers per 1,000 residents here: | 1.09 |
| California average: | 2.32 |
Full-time law enforcement employees in 2016, including police officers: 360 (215 officers - 196 male; 19 female).
| Officers per 1,000 residents here: | 0.99 |
| California average: | 2.32 |
Full-time law enforcement employees in 2015, including police officers: 394 (214 officers - 195 male; 19 female).
| Officers per 1,000 residents here: | 0.99 |
| California average: | 1.98 |
Full-time law enforcement employees in 2014, including police officers: 358 (225 officers - 206 male; 19 female).
| Officers per 1,000 residents here: | 1.05 |
| California average: | 2.00 |
Full-time law enforcement employees in 2013, including police officers: 400 (246 officers - 224 male; 22 female).
| Officers per 1,000 residents here: | 1.15 |
| California average: | 2.34 |
Full-time law enforcement employees in 2012, including police officers: 428 (272 officers - 247 male; 25 female).
| Officers per 1,000 residents here: | 1.27 |
| California average: | 2.36 |
Full-time law enforcement employees in 2011, including police officers: 465 (296 officers - 269 male; 27 female).
| Officers per 1,000 residents here: | 1.39 |
| California average: | 2.09 |
Full-time law enforcement employees in 2010, including police officers: 484 (319 officers - 291 male; 28 female).
| Officers per 1,000 residents here: | 1.52 |
| California average: | 2.46 |
Full-time law enforcement employees in 2009, including police officers: 468 (324 officers - 297 male; 27 female).
| Officers per 1,000 residents here: | 1.62 |
| California average: | 2.52 |
Full-time law enforcement employees in 2008, including police officers: 488 (343 officers - 314 male; 29 female).
| Officers per 1,000 residents here: | 1.71 |
| California average: | 2.55 |
Full-time law enforcement employees in 2007, including police officers: 499 (330 officers - 302 male; 28 female).
| Officers per 1,000 residents here: | 1.64 |
| California average: | 2.48 |
Full-time law enforcement employees in 2006, including police officers: 466 (308 officers - 282 male; 26 female).
| Officers per 1,000 residents here: | 1.54 |
| California average: | 2.38 |
Full-time law enforcement employees in 2005, including police officers: 462 (302 officers - 278 male; 24 female).
| Officers per 1,000 residents here: | 1.51 |
| California average: | 2.34 |
Full-time law enforcement employees in 2004, including police officers: 446 (289 officers - 269 male; 20 female).
| Officers per 1,000 residents here: | 1.46 |
| California average: | 2.36 |
Full-time law enforcement employees in 2003, including police officers: 465 (295 officers - 274 male; 21 female).
| Officers per 1,000 residents here: | 1.52 |
| California average: | 2.42 |