Hilliard, Ohio

Hilliard: View of Mill Run in Hilliard on a summer eveing.
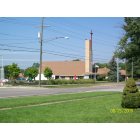
Hilliard: Hilliard United Methodist Church
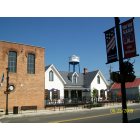
Hilliard: Main Street, Old Hilliard

Hilliard: "Blooming Firework" at Hilliard Community Center 2007
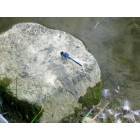
Hilliard: dragonfly at Homestead Park
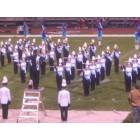
Hilliard: Hilliard Darby Marching Band
- add
your
Submit your own pictures of this city and show them to the world
- OSM Map
- General Map
- Google Map
- MSN Map
Population change since 2000: +54.3%
 |
| Males: 18,264 | |
| Females: 19,113 |
| Median resident age: | 36.5 years |
| Ohio median age: | 39.9 years |
Zip codes: 43026.
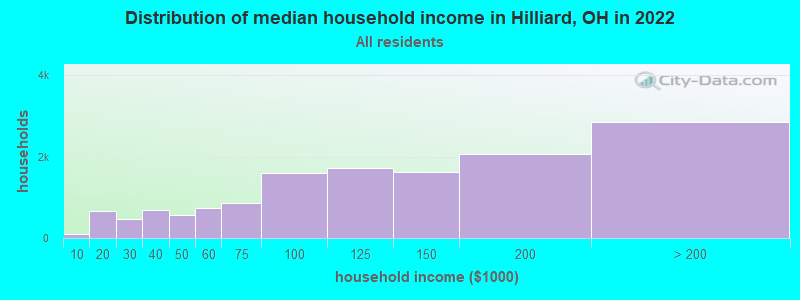
| Hilliard: | $114,014 |
| OH: | $65,720 |
Estimated per capita income in 2022: $53,261 (it was $28,496 in 2000)
Hilliard city income, earnings, and wages data
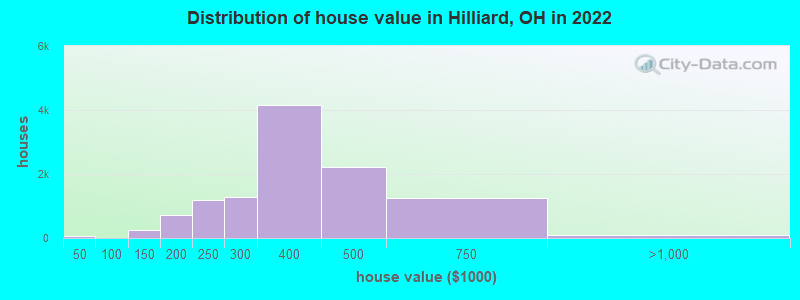
Estimated median house or condo value in 2022: $386,793 (it was $156,100 in 2000)
| Hilliard: | $386,793 |
| OH: | $204,100 |
Mean prices in 2022: all housing units: $338,853; detached houses: $346,689; townhouses or other attached units: $246,256; in 2-unit structures: $337,743; in 3-to-4-unit structures: $237,037
Median gross rent in 2022: $1,573.
(4.8% for White Non-Hispanic residents, 5.7% for Black residents, 14.8% for Hispanic or Latino residents, 40.0% for American Indian residents, 37.2% for other race residents, 11.1% for two or more races residents)
Detailed information about poverty and poor residents in Hilliard, OH


Compare current foreclosures in Hilliard, OH:
| Photo | Address | Area | Beds / Baths | Price | Details |
|---|---|---|---|---|---|

|
#1
Nike Dr
Hilliard, OH 43026
|
1,668 sq. feet
|
3 baths 3 beds |
show details | |

|
#2
Rutgers Ln
Hilliard, OH 43026
|
832 sq. feet
|
1 baths 2 beds |
show details | |

|
#3
Patcon Way
Hilliard, OH 43026
|
1,280 sq. feet
|
2 baths 3 beds |
show details | |

|
#4
Stoneybrook Blvd
Hilliard, OH 43026
|
1,031 sq. feet
|
2 baths 3 beds |
show details | |

|
#5
Heritage Farms Dr
Hilliard, OH 43026
|
2,180 sq. feet
|
4 baths 4 beds |
show details | |

|
#6
Heritage Lakes Dr
Hilliard, OH 43026
|
3,895 sq. feet
|
5 baths 4 beds |
show details | |

|
#7
Fairway Commons Dr
Hilliard, OH 43026
|
2,654 sq. feet
|
3 baths 3 beds |
show details | |

|
#8
Silo Ct
Hilliard, OH 43026
|
2,865 sq. feet
|
4 baths 4 beds |
show details | |

|
#9
Redlands Dr
Hilliard, OH 43026
|
1,542 sq. feet
|
3 baths 3 beds |
show details | |

|
#10
Valencia Park Blvd
Hilliard, OH 43026
|
1,024 sq. feet
|
2 baths 2 beds |
show details |
| Photo | Address | Area | Beds / Baths | Price | Details |
|---|---|---|---|---|---|

|
#11
Snow Dr
Hilliard, OH 43026
|
1,024 sq. feet
|
2 baths 3 beds |
show details | |

|
#12
Hobbes Dr
Hilliard, OH 43026
|
832 sq. feet
|
1 baths 2 beds |
show details | |

|
#13
Meadowsview Ln
Hilliard, OH 43026
|
2,972 sq. feet
|
4 baths 4 beds |
show details | |

|
#14
Singleton Dr
Hilliard, OH 43026
|
839 sq. feet
|
1 baths 2 beds |
show details | |

|
#15
Westrock Dr
Hilliard, OH 43026
|
1,819 sq. feet
|
3 baths 3 beds |
show details | |

|
#16
Paxton Dr
Hilliard, OH 43026
|
900 sq. feet
|
1 baths 3 beds |
show details | |

|
#17
Scioto Darby Rd
Hilliard, OH 43026
|
1,152 sq. feet
|
2 baths 3 beds |
show details | |

|
#18
Canehill Ln
Hilliard, OH 43026
|
1,152 sq. feet
|
3 baths 2 beds |
show details | |

|
#19
Holland Dr
Hilliard, OH 43026
|
832 sq. feet
|
2 baths 2 beds |
show details | |

|
#20
Marilyn St
Hilliard, OH 43026
|
1,944 sq. feet
|
3 baths 3 beds |
show details |
| Photo | Address | Area | Beds / Baths | Price | Details |
|---|---|---|---|---|---|

|
#21
Pleasant Hill Dr
Hilliard, OH 43026
|
2,204 sq. feet
|
3 baths 4 beds |
show details | |

|
#22
Nadine Park Dr
Hilliard, OH 43026
|
2,890 sq. feet
|
3 baths 4 beds |
show details | |

|
#23
Walborn Dr
Hilliard, OH 43026
|
1,826 sq. feet
|
2 baths 4 beds |
show details | |

|
#24
Westrock Dr
Hilliard, OH 43026
|
1,624 sq. feet
|
2 baths 4 beds |
show details | |

|
#25
Edgewyn Ave
Hilliard, OH 43026
|
900 sq. feet
|
1 baths 3 beds |
show details | |

|
#26
Earman Dr
Hilliard, OH 43026
|
1,766 sq. feet
|
2 baths 4 beds |
show details | |

|
#27
Bressler Dr
Hilliard, OH 43026
|
1,708 sq. feet
|
1 baths 4 beds |
show details | |

|
#28
Mango Ln
Hilliard, OH 43026
|
1,024 sq. feet
|
1 baths 2 beds |
show details | |

|
#29
Hillcrest St N
Hilliard, OH 43026
|
1,565 sq. feet
|
2 baths 3 beds |
show details | |

|
#30
Mengel Ln
Hilliard, OH 43026
|
1,548 sq. feet
|
1 baths 3 beds |
show details |
| Photo | Address | Area | Beds / Baths | Price | Details |
|---|---|---|---|---|---|

|
#31
Ridgebury Dr
Hilliard, OH 43026
|
832 sq. feet
|
1 baths 2 beds |
show details | |

|
#32
Coventry Manor Way
Hilliard, OH 43026
|
1,485 sq. feet
|
2 baths 2 beds |
show details | |

|
#33
Mango Ln
Hilliard, OH 43026
|
1,024 sq. feet
|
1 baths 2 beds |
show details | |

|
#34
Westbriar Dr
Hilliard, OH 43026
|
2,700 sq. feet
|
2 baths 4 beds |
show details | |

|
#35
Darbyshire Dr
Hilliard, OH 43026
|
1,775 sq. feet
|
2 baths 3 beds |
show details | |

|
#36
Dayspring Dr
Hilliard, OH 43026
|
2,226 sq. feet
|
2 baths 4 beds |
show details | |

|
#37
Wyandot Pl
Hilliard, OH 43026
|
972 sq. feet
|
1 baths 3 beds |
show details | |

|
#38
Stonesthrow Ct W
Hilliard, OH 43026
|
2,128 sq. feet
|
2 baths 3 beds |
show details | |

|
#39
Jupiter Ave
Hilliard, OH 43026
|
1,320 sq. feet
|
1 baths 3 beds |
show details | |

|
#40
Lonerise Ln
Hilliard, OH 43026
|
1,622 sq. feet
|
2 baths 3 beds |
show details |
| Photo | Address | Area | Beds / Baths | Price | Details |
|---|---|---|---|---|---|

|
#41
Stoneybrook B 21a
Hilliard, OH 43026
|
1,031 sq. feet
|
1 baths 3 beds |
show details | |

|
#42
Edgewyn Ave
Hilliard, OH 43026
|
900 sq. feet
|
1 baths 3 beds |
show details | |

|
#43
Leybourne Dr
Hilliard, OH 43026
|
1,632 sq. feet
|
2 baths 3 beds |
show details | |

|
#44
Stoneybrook Blvd
Hilliard, OH 43026
|
1,031 sq. feet
|
1 baths 3 beds |
show details | |

|
#45
Messner Dr
Hilliard, OH 43026
|
832 sq. feet
|
1 baths 2 beds |
show details | |

|
#46
Shelby Ln
Hilliard, OH 43026
|
1,464 sq. feet
|
2 baths 3 beds |
show details | |

|
#47
Bigelow Dr
Hilliard, OH 43026
|
1,206 sq. feet
|
1 baths 3 beds |
show details | |

|
#48
Nike Dr
Hilliard, OH 43026
|
1,560 sq. feet
|
1 baths 3 beds |
show details | |

|
#49
Jeffey Dr
Hilliard, OH 43026
|
1,996 sq. feet
|
2 baths 4 beds |
show details | |

|
Check over 1 million property listings on Foreclosure.com!
|
browse all offers | |||


- 27,90177.1%White alone
- 2,8457.9%Asian alone
- 2,2986.3%Two or more races
- 1,5774.4%Hispanic
- 1,5314.2%Black alone
- 620.2%American Indian alone
- 610.2%Other race alone
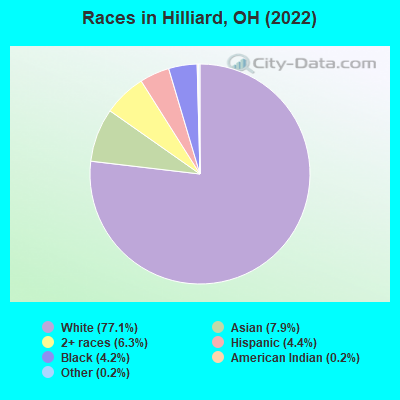
Races in Hilliard detailed stats: ancestries, foreign born residents, place of birth
According to our research of Ohio and other state lists, there were 32 registered sex offenders living in Hilliard, Ohio as of June 04, 2024.
The ratio of all residents to sex offenders in Hilliard is 1,062 to 1.
The ratio of registered sex offenders to all residents in this city is lower than the state average.
Type |
2009 |
2010 |
2011 |
2012 |
2013 |
2016 |
2017 |
2018 |
2019 |
2020 |
2021 |
2022 |
|---|---|---|---|---|---|---|---|---|---|---|---|---|
| Murders (per 100,000) | 0 (0.0) | 0 (0.0) | 2 (7.0) | 0 (0.0) | 1 (3.2) | 0 (0.0) | 0 (0.0) | 0 (0.0) | 0 (0.0) | 0 (0.0) | 0 (0.0) | 0 (0.0) |
| Rapes (per 100,000) | 4 (14.1) | 4 (14.1) | 0 (0.0) | 1 (3.5) | 8 (25.5) | 12 (34.5) | 7 (19.4) | 14 (37.7) | 9 (24.0) | 8 (21.3) | 10 (26.5) | 7 (19.1) |
| Robberies (per 100,000) | 22 (77.7) | 11 (38.7) | 11 (38.7) | 15 (52.1) | 8 (25.5) | 12 (34.5) | 3 (8.3) | 8 (21.5) | 5 (13.3) | 11 (29.3) | 8 (21.2) | 5 (13.6) |
| Assaults (per 100,000) | 7 (24.7) | 6 (21.1) | 5 (17.6) | 4 (13.9) | 9 (28.7) | 13 (37.3) | 10 (27.7) | 17 (45.7) | 16 (42.6) | 7 (18.6) | 15 (39.7) | 40 (109.2) |
| Burglaries (per 100,000) | 154 (543.7) | 159 (559.2) | 141 (495.5) | 148 (513.6) | 127 (405.1) | 76 (218.2) | 75 (207.5) | 47 (126.4) | 32 (85.2) | 39 (103.8) | 28 (74.1) | 35 (95.5) |
| Thefts (per 100,000) | 739 (2,609) | 642 (2,258) | 592 (2,080) | 584 (2,027) | 565 (1,802) | 270 (775.1) | 299 (827.2) | 183 (492.1) | 197 (524.2) | 212 (564.1) | 294 (778.3) | 287 (783.2) |
| Auto thefts (per 100,000) | 37 (130.6) | 27 (95.0) | 20 (70.3) | 31 (107.6) | 27 (86.1) | 24 (68.9) | 36 (99.6) | 23 (61.9) | 16 (42.6) | 16 (42.6) | 28 (74.1) | 30 (81.9) |
| Arson (per 100,000) | 10 (35.3) | 7 (24.6) | 8 (28.1) | 4 (13.9) | 5 (15.9) | 4 (11.5) | 2 (5.5) | 3 (8.1) | 0 (0.0) | 2 (5.3) | 1 (2.6) | 1 (2.7) |
| City-Data.com crime index | 192.4 | 164.1 | 152.7 | 146.8 | 147.5 | 97.2 | 79.1 | 79.2 | 62.0 | 62.8 | 77.7 | 85.8 |
The City-Data.com crime index weighs serious crimes and violent crimes more heavily. Higher means more crime, U.S. average is 246.1. It adjusts for the number of visitors and daily workers commuting into cities.
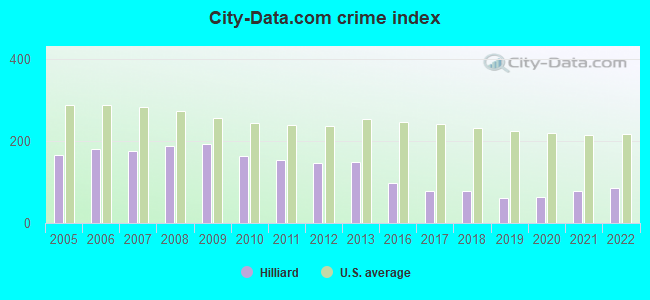
Crime rate in Hilliard detailed stats: murders, rapes, robberies, assaults, burglaries, thefts, arson
Full-time law enforcement employees in 2020, including police officers: 75 (63 officers - 56 male; 7 female).
| Officers per 1,000 residents here: | 1.68 |
| Ohio average: | 2.24 |
 Recent articles from our blog. Our writers, many of them Ph.D. graduates or candidates, create easy-to-read articles on a wide variety of topics.


Latest news from Hilliard, OH collected exclusively by city-data.com from local newspapers, TV, and radio stations
Ancestries: German (14.6%), Irish (9.6%), American (8.7%), English (7.9%), Italian (5.0%), European (4.0%).
Current Local Time: EST time zone
Incorporated in 1981
Elevation: 935 feet
Land area: 11.1 square miles.
Population density: 3,355 people per square mile (average).
3,584 residents are foreign born (6.7% Asia, 1.2% Latin America).
| This city: | 9.9% |
| Ohio: | 4.9% |
Median real estate property taxes paid for housing units with mortgages in 2022: $7,136 (1.8%)
Median real estate property taxes paid for housing units with no mortgage in 2022: $6,860 (1.9%)
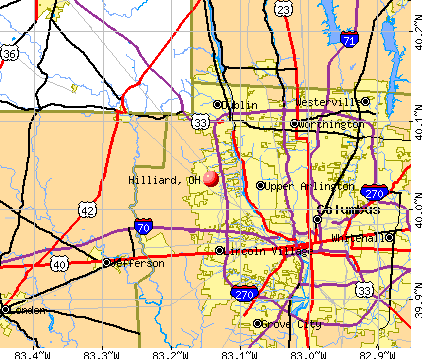
Nearest city with pop. 50,000+: Columbus, OH  (8.6 miles , pop. 711,470).
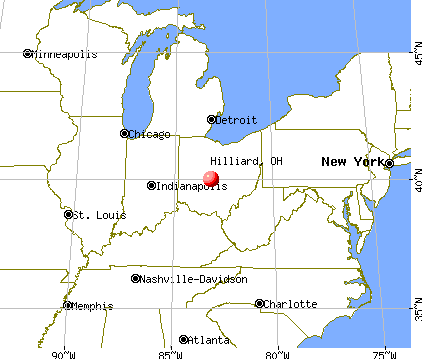
Nearest city with pop. 1,000,000+: Chicago, IL (267.9 miles , pop. 2,896,016).
Nearest cities:
), ), ), ), )Latitude: 40.03 N, Longitude: 83.14 W
Daytime population change due to commuting: -846 (-2.3%)
Workers who live and work in this city: 6,097 (29.8%)
Area code: 614
Property values in Hilliard, OH
Hilliard, Ohio accommodation & food services, waste management - Economy and Business Data
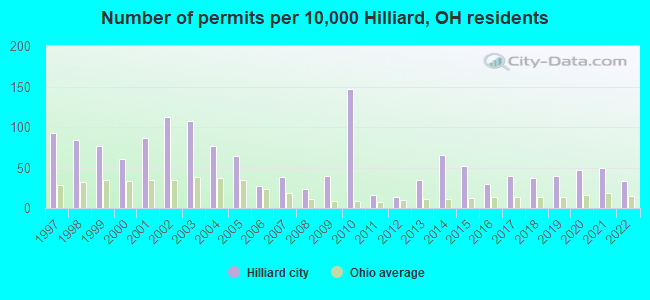
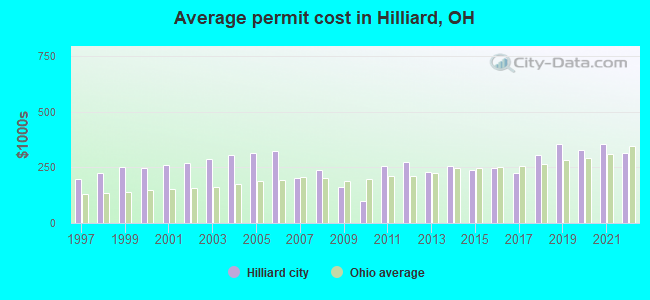
Single-family new house construction building permits:
- 2022: 81 buildings, average cost: $312,500
- 2021: 118 buildings, average cost: $353,200
- 2020: 114 buildings, average cost: $325,600
- 2019: 98 buildings, average cost: $353,200
- 2018: 89 buildings, average cost: $302,800
- 2017: 98 buildings, average cost: $223,600
- 2016: 72 buildings, average cost: $248,600
- 2015: 127 buildings, average cost: $238,700
- 2014: 158 buildings, average cost: $257,600
- 2013: 85 buildings, average cost: $229,700
- 2012: 35 buildings, average cost: $274,400
- 2011: 38 buildings, average cost: $253,600
- 2010: 357 buildings, average cost: $97,000
- 2009: 96 buildings, average cost: $161,400
- 2008: 58 buildings, average cost: $240,400
- 2007: 92 buildings, average cost: $204,400
- 2006: 65 buildings, average cost: $321,600
- 2005: 156 buildings, average cost: $312,400
- 2004: 186 buildings, average cost: $304,000
- 2003: 260 buildings, average cost: $287,400
- 2002: 272 buildings, average cost: $268,700
- 2001: 211 buildings, average cost: $262,300
- 2000: 147 buildings, average cost: $248,200
- 1999: 184 buildings, average cost: $253,200
- 1998: 204 buildings, average cost: $223,100
- 1997: 226 buildings, average cost: $197,300
| Here: | 2.3% |
| Ohio: | 3.1% |
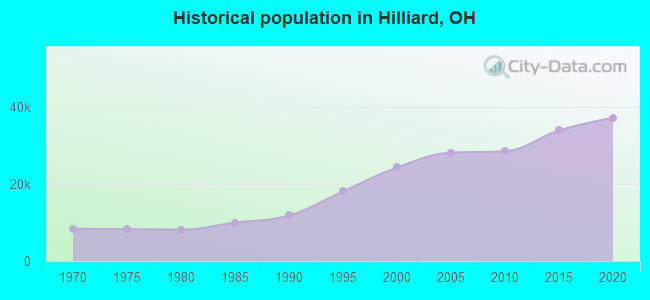
Population change in the 1990s: +12,010 (+98.3%).
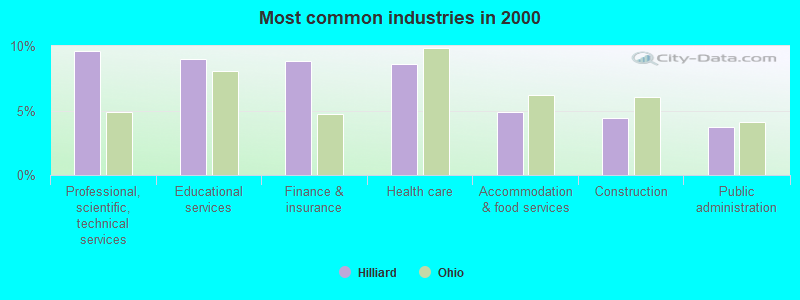
- Professional, scientific, technical services (9.6%)
- Educational services (9.0%)
- Finance & insurance (8.8%)
- Health care (8.6%)
- Accommodation & food services (4.9%)
- Construction (4.4%)
- Public administration (3.8%)
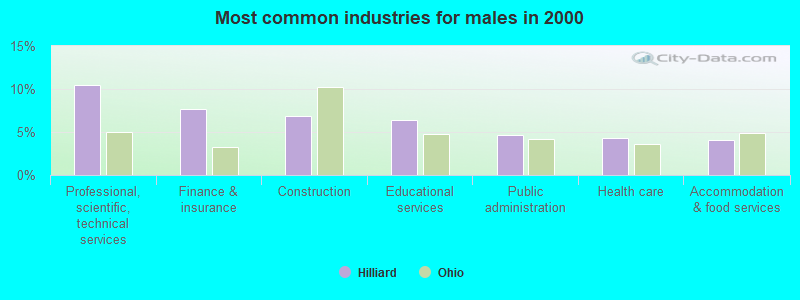
- Professional, scientific, technical services (10.5%)
- Finance & insurance (7.6%)
- Construction (6.9%)
- Educational services (6.4%)
- Public administration (4.6%)
- Health care (4.3%)
- Accommodation & food services (4.1%)
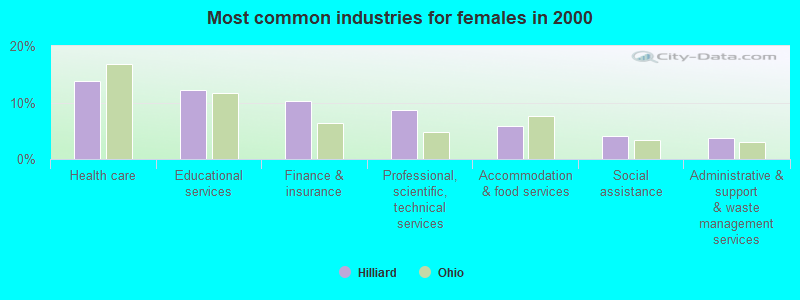
- Health care (13.8%)
- Educational services (12.1%)
- Finance & insurance (10.2%)
- Professional, scientific, technical services (8.6%)
- Accommodation & food services (5.9%)
- Social assistance (4.0%)
- Administrative & support & waste management services (3.8%)
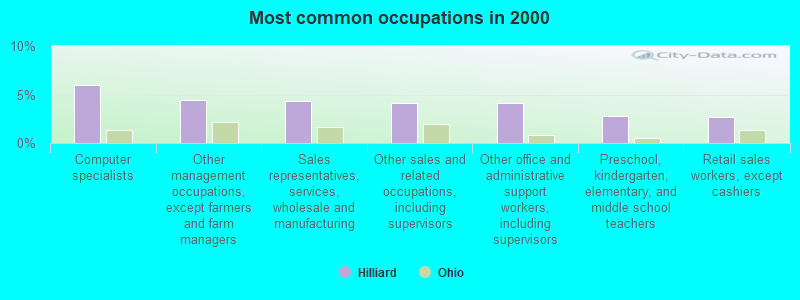
- Computer specialists (6.0%)
- Other management occupations, except farmers and farm managers (4.5%)
- Sales representatives, services, wholesale and manufacturing (4.3%)
- Other sales and related occupations, including supervisors (4.1%)
- Other office and administrative support workers, including supervisors (4.1%)
- Preschool, kindergarten, elementary, and middle school teachers (2.8%)
- Retail sales workers, except cashiers (2.6%)

- Computer specialists (7.7%)
- Sales representatives, services, wholesale and manufacturing (5.9%)
- Other management occupations, except farmers and farm managers (4.3%)
- Other sales and related occupations, including supervisors (4.2%)
- Top executives (3.9%)
- Engineers (3.7%)
- Driver/sales workers and truck drivers (3.4%)

- Other office and administrative support workers, including supervisors (6.9%)
- Secretaries and administrative assistants (5.5%)
- Preschool, kindergarten, elementary, and middle school teachers (4.8%)
- Other management occupations, except farmers and farm managers (4.7%)
- Other sales and related occupations, including supervisors (4.0%)
- Computer specialists (3.9%)
- Registered nurses (3.4%)
Average climate in Hilliard, Ohio
Based on data reported by over 4,000 weather stations


|
|


(lower is better)
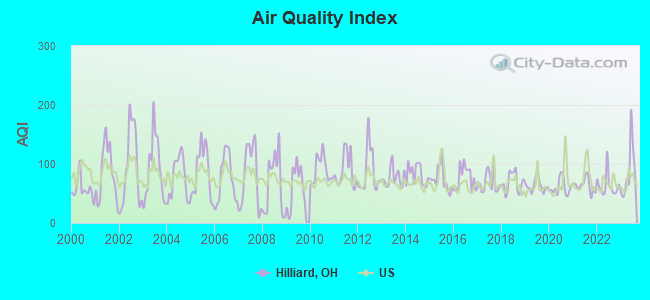
Air Quality Index (AQI) level in 2023 was 86.3. This is about average.
| City: | 86.3 |
| U.S.: | 72.6 |
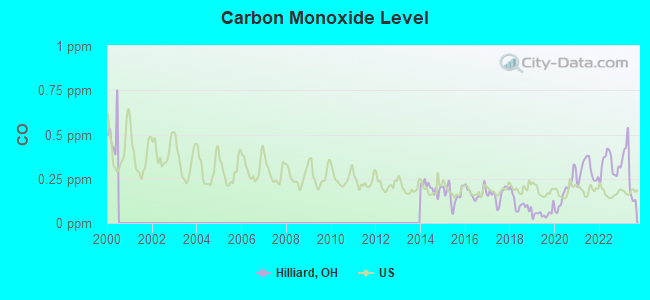
Carbon Monoxide (CO) [ppm] level in 2023 was 0.293. This is about average. Closest monitor was 6.1 miles away from the city center.
| City: | 0.293 |
| U.S.: | 0.251 |
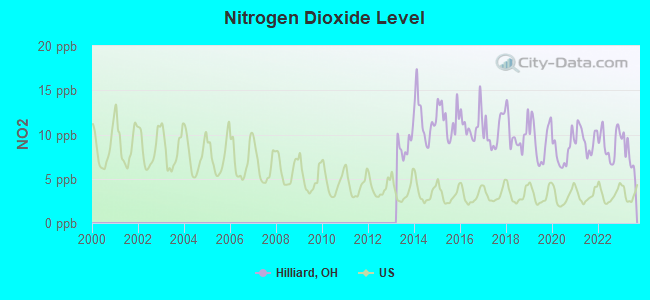
Nitrogen Dioxide (NO2) [ppb] level in 2023 was 7.70. This is significantly worse than average. Closest monitor was 6.1 miles away from the city center.
| City: | 7.70 |
| U.S.: | 5.11 |
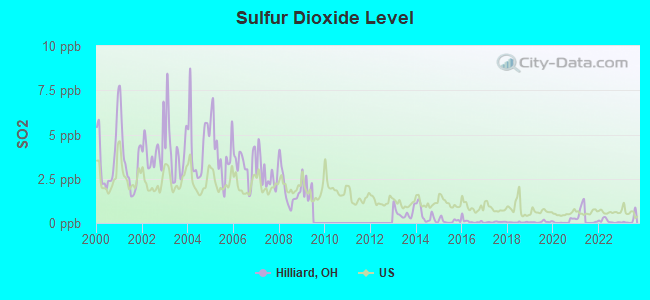
Sulfur Dioxide (SO2) [ppb] level in 2023 was 0.155. This is significantly better than average. Closest monitor was 6.1 miles away from the city center.
| City: | 0.155 |
| U.S.: | 1.515 |
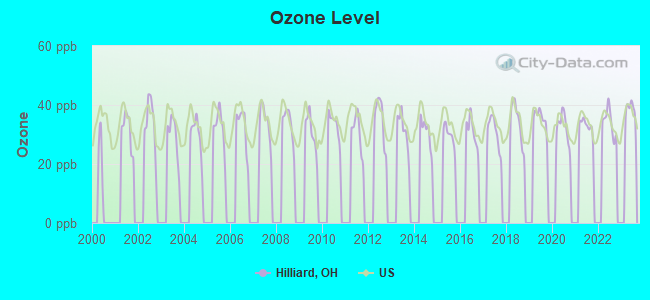
Ozone [ppb] level in 2022 was 34.2. This is about average. Closest monitor was 6.1 miles away from the city center.
| City: | 34.2 |
| U.S.: | 33.3 |
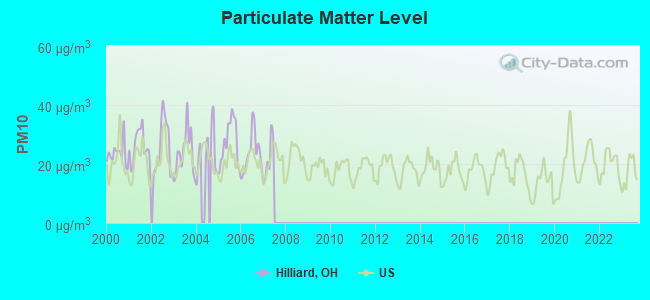
Particulate Matter (PM10) [µg/m3] level in 2006 was 23.7. This is worse than average. Closest monitor was 6.1 miles away from the city center.
| City: | 23.7 |
| U.S.: | 19.2 |
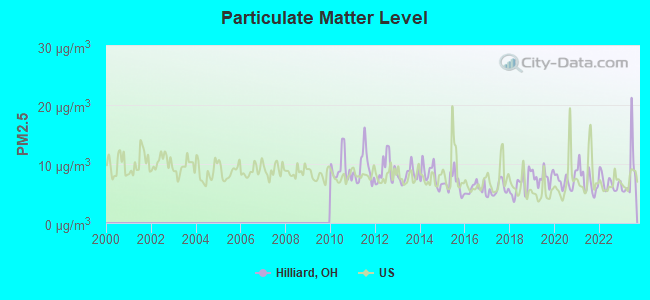
Particulate Matter (PM2.5) [µg/m3] level in 2023 was 8.34. This is about average. Closest monitor was 8.2 miles away from the city center.
| City: | 8.34 |
| U.S.: | 8.11 |
Tornado activity:
Hilliard-area historical tornado activity is near Ohio state average. It is 24% greater than the overall U.S. average.
On 4/3/1974, a category F5 (max. wind speeds 261-318 mph) tornado 25.5 miles away from the Hilliard city center killed 36 people and injured 1150 people and caused between $50,000,000 and $500,000,000 in damages.
On 2/22/1971, a category F3 (max. wind speeds 158-206 mph) tornado 12.1 miles away from the city center injured 7 people and caused between $500,000 and $5,000,000 in damages.
Earthquake activity:
Hilliard-area historical earthquake activity is significantly above Ohio state average. It is 2% smaller than the overall U.S. average.On 7/27/1980 at 18:52:21, a magnitude 5.2 (5.1 MB, 4.7 MS, 5.0 UK, 5.2 UK, Class: Moderate, Intensity: VI - VII) earthquake occurred 133.6 miles away from Hilliard center
On 9/25/1998 at 19:52:52, a magnitude 5.2 (4.8 MB, 4.3 MS, 5.2 LG, 4.5 MW, Depth: 3.1 mi) earthquake occurred 175.6 miles away from the city center
On 1/31/1986 at 16:46:43, a magnitude 5.0 (5.0 MB) earthquake occurred 150.1 miles away from the city center
On 8/23/2011 at 17:51:04, a magnitude 5.8 (5.8 MW, Depth: 3.7 mi) earthquake occurred 316.1 miles away from Hilliard center
On 7/12/1986 at 08:19:37, a magnitude 4.5 (4.5 MB, Class: Light, Intensity: IV - V) earthquake occurred 73.5 miles away from the city center
On 4/18/2008 at 09:36:59, a magnitude 5.4 (5.1 MB, 4.8 MS, 5.4 MW, 5.2 MW) earthquake occurred 276.6 miles away from the city center
Magnitude types: regional Lg-wave magnitude (LG), body-wave magnitude (MB), surface-wave magnitude (MS), moment magnitude (MW)
Natural disasters:
The number of natural disasters in Franklin County (16) is near the US average (15).Major Disasters (Presidential) Declared: 11
Emergencies Declared: 4
Causes of natural disasters: Storms: 9, Floods: 7, Tornadoes: 6, Winds: 3, Mudslides: 2, Snows: 2, Blizzard: 1, Hurricane: 1, Landslide: 1, Snowstorm: 1, Tropical Depression: 1, Winter Storm: 1, Other: 1 (Note: some incidents may be assigned to more than one category).
Hospitals and medical centers in Hilliard:
- ASPIRE HOME HEALTHCARE OF OHIO (5556 HILLIARD ROME OFFICE PARK)
- EXTENDED LIFE HOME CARE, LTD (5560 HILLIARD ROME OFFICE PARK)
- KEYCARE NURSING SERVICE (5378 WHIRLWIND COVE DRIVE)
- ALTERCARE OF HILLIARD POST-ACUTE CENTER (4660 TRUEMAN BLVD)
- DARBY GLENN NURSING AND REHABILITATION CENTER (4787 TREMONT CLUB DRIVE)
- LAURELS OF HILLIARD THE (5471 SCIOTO DARBY ROAD)
- MILL RUN CARE CENTER (3399 MILL RUN DRIVE)
College/University in Hilliard:
Colleges/universities with over 2000 students nearest to Hilliard:
- Ohio State University-Main Campus (about 8 miles; Columbus, OH; Full-time enrollment: 50,395)
- Columbus State Community College (about 10 miles; Columbus, OH; FT enrollment: 24,488)
- Franklin University (about 10 miles; Columbus, OH; FT enrollment: 3,736)
- Ohio Dominican University (about 12 miles; Columbus, OH; FT enrollment: 2,045)
- Capital University (about 13 miles; Columbus, OH; FT enrollment: 3,029)
- DeVry University-Ohio (about 13 miles; Columbus, OH; FT enrollment: 3,896)
- Otterbein University (about 13 miles; Westerville, OH; FT enrollment: 2,933)
Public high schools in Hilliard:
- HILLIARD DAVIDSON HIGH SCHOOL (Students: 1,856, Location: 5100 DAVIDSON RD, Grades: 9-12)
- HILLIARD DARBY HIGH SCHOOL (Students: 1,600, Location: 4200 LEPPERT RD, Grades: 9-12)
- HILLIARD WEAVER MIDDLE SCHOOL (Students: 880, Location: 4600 AVERY RD, Grades: 6-9)
- HILLIARD HERITAGE MIDDLE SCHOOL (Students: 729, Location: 5670 SCIOTO DARBY RD, Grades: 6-9)
- HILLIARD BRADLEY HIGH SCHOOL (Location: 2800 WALKER RD, Grades: 9-12)
Biggest public elementary/middle schools in Hilliard:
- HILLIARD MEMORIAL MIDDLE SCHOOL (Students: 766, Location: 5600 SCIOTO DARBY RD, Grades: 7-8)
- HILLIARD THARP SIXTH GRADE ELEMENTARY SCHOOL (Students: 647, Location: 4681 LEAP RD, Grades: 6)
- DARBY CREEK ELEMENTARY SCHOOL (Students: 569, Location: 6305 PINEFIELD DR, Grades: KG-5)
- BROWN ELEMENTARY SCHOOL (Students: 535, Location: 2494 WALKER RD, Grades: KG-5)
- HILLIARD CROSSING ELEMENTARY SCHOOL (Students: 533, Location: 3340 HILLIARD ROME RD, Grades: KG-5)
- HILLIARD STATION SIXTH GRADE ELEMENTARY SCHOOL (Students: 524, Location: 3859 MAIN ST, Grades: 6)
- NORWICH ELEMENTARY SCHOOL (Students: 513, Location: 4454 DAVIDSON RD, Grades: KG-5)
- BEACON ELEMENTARY SCHOOL (Students: 500, Location: 3600 LACON RD, Grades: KG-5)
- RIDGEWOOD ELEMENTARY SCHOOL (Students: 493, Location: 4237 DUBLIN RD, Grades: KG-5)
- SCIOTO DARBY ELEMENTARY SCHOOL (Students: 481, Location: 5380 SCIOTO DARBY RD, Grades: KG-5)
Private elementary/middle schools in Hilliard:
- ST BRENDAN SCHOOL (Students: 483, Location: 4475 DUBLIN RD, Grades: KG-8)
- SUNRISE ACADEMY (Students: 417, Location: 5657 SCIOTO DARBY RD, Grades: PK-8)
User-submitted facts and corrections:
- The River Radio Station (FM) 104.9 added by De
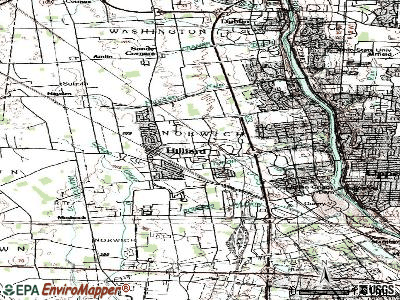
Points of interest:
Notable locations in Hilliard: Franklin County Fairgrounds (A), Hilliard Corporate Center (B), Hilliard Industrial Park (C), Freeway Business Park (D), Norwich Township Fire Department Station 81 (E), Norwich Township Fire Department Station 83 Headquarters (F), Hilliard City Hall (G). Display/hide their locations on the map
Shopping Center: Hilliard Square Shopping Center (1). Display/hide its location on the map
Churches in Hilliard include: Hilliard Church of Christ (A), Hilliard Freewill Baptist Church (B), Hilliard Mill Run Nazarene Church (C), Hilliard Presbyterian Church (D), Saint Brendan Catholic Church (E), Hilliard United Methodist Church (F). Display/hide their locations on the map
Parks in Hilliard include: Hilliard Municipal Park (1), Hamilton Park (2). Display/hide their locations on the map
Tourist attractions: Early Television Museum (5396 Franklin Street), Cruise Quarters and Tours (Tours & Charters; 5208 Epsom Court), AAA Auto Club - AAA Service Offices- AAA Insurance Agency- AAA Travel Agency- (Tours & Charters; 3671 Fishinger Boulevard).
Hotels: Hampton Inn and Suites Columbus Hilliard (3950 Lyman Drive), Comfort Suites Hilliard (3831 Park Mill Run Drive).
Birthplace of: Jeremy Ebert - Football player.
Drinking water stations with addresses in Hilliard and their reported violations in the past:
MAKOY CENTER, INC. (Population served: 200, Groundwater):Past health violations:COMMUNITY GARDENS MHP (Population served: 150, Groundwater):
- MCL, Monthly (TCR) - Between OCT-2007 and DEC-2007, Contaminant: Coliform. Follow-up actions: St Public Notif requested (OCT-25-2007), St Violation/Reminder Notice (OCT-25-2007), St Compliance achieved (NOV-13-2008)
- MCL, Acute (TCR) - Between OCT-2007 and DEC-2007, Contaminant: Coliform. Follow-up actions: St Public Notif requested (OCT-25-2007), St Violation/Reminder Notice (OCT-25-2007), St Compliance achieved (NOV-13-2008)
Past monitoring violations:
- Lead Consumer Notice - In DEC-31-2011, Contaminant: Lead and Copper Rule. Follow-up actions: St Violation/Reminder Notice (FEB-09-2012), St Compliance achieved (MAR-22-2012)
Drinking water stations with addresses in Hilliard that have no violations reported:
- KUHLWEINS FARM MARKET PWS (Population served: 100, Primary Water Source Type: Groundwater)
| This city: | 2.8 people |
| Ohio: | 2.4 people |
| This city: | 74.6% |
| Whole state: | 65.0% |
| This city: | 4.8% |
| Whole state: | 6.8% |
Likely homosexual households (counted as self-reported same-sex unmarried-partner households)
- Lesbian couples: 0.4% of all households
- Gay men: 0.2% of all households
227 people in nursing homes in 2000
2 people in other noninstitutional group quarters in 2000
Banks with branches in Hilliard (2011 data):
- U.S. Bank National Association: Hilliard Square Kroger Branch, Hayden Run Road Giant Eagle Branch, Hilliard Branch, Rome-Hilliard Giant Eagle Branch. Info updated 2012/01/30: Bank assets: $330,470.8 mil, Deposits: $236,091.5 mil, headquarters in Cincinnati, OH, positive income, 3121 total offices, Holding Company: U.S. Bancorp
- Fifth Third Bank: Hilliard/ Main at 3800 Main St, branch established on 1900/01/01; Hilliard South Banking Center Branch at 2455 Hilliard Rome Road, branch established on 2004/05/03. Info updated 2009/10/05: Bank assets: $114,540.4 mil, Deposits: $89,689.1 mil, headquarters in Cincinnati, OH, positive income, Commercial Lending Specialization, 1378 total offices, Holding Company: Fifth Third Bancorp
- KeyBank National Association: Nike Drive Branch at 2130 Hilliard-Rome Road, branch established on 2007/04/30; Hilliard Branch at 5390 Cemetery Road, branch established on 1977/01/10. Info updated 2008/03/03: Bank assets: $86,198.8 mil, Deposits: $64,214.8 mil, headquarters in Cleveland, OH, positive income, Commercial Lending Specialization, 1067 total offices, Holding Company: Keycorp
- PNC Bank, National Association: Hilliard Branch at 4650 Cemetery Road, branch established on 1978/07/17; Hilliard-Rome Branch at 1715 Hilliard-Rome Road, branch established on 1994/03/28. Info updated 2012/03/20: Bank assets: $263,309.6 mil, Deposits: $197,343.0 mil, headquarters in Wilmington, DE, positive income, Commercial Lending Specialization, 3085 total offices, Holding Company: Pnc Financial Services Group, Inc., The
- JPMorgan Chase Bank, National Association: Hilliard Darby Banking Center Branch at 6364 Scioto Darby Road, branch established on 2006/05/23; Hilliard Branch at 4056 East Main Street, branch established on 1963/09/03. Info updated 2011/11/10: Bank assets: $1,811,678.0 mil, Deposits: $1,190,738.0 mil, headquarters in Columbus, OH, positive income, International Specialization, 5577 total offices, Holding Company: Jpmorgan Chase & Co.
- The Citizens Banking Company: Hilliard Branch at 4501 Cemetery Road, branch established on 2004/10/25. Info updated 2008/01/02: Bank assets: $1,108.0 mil, Deposits: $909.0 mil, headquarters in Sandusky, OH, positive income, Commercial Lending Specialization, 28 total offices, Holding Company: First Citizens Banc Corp
- The Huntington National Bank: Mill Run Branch at 3650 Fishinger Boulevard, branch established on 1990/06/04. Info updated 2012/04/02: Bank assets: $54,183.4 mil, Deposits: $44,300.3 mil, headquarters in Columbus, OH, positive income, Commercial Lending Specialization, 878 total offices, Holding Company: Huntington Bancshares Incorporated
For population 15 years and over in Hilliard:
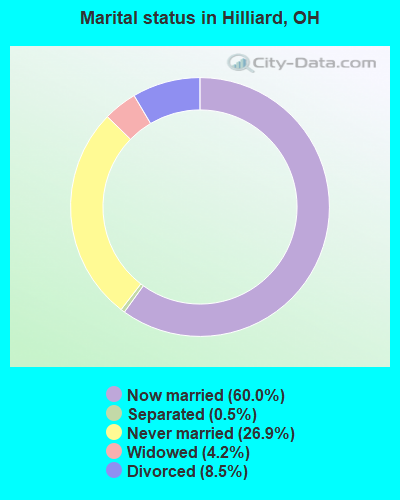
- Never married: 26.9%
- Now married: 60.0%
- Separated: 0.5%
- Widowed: 4.2%
- Divorced: 8.5%
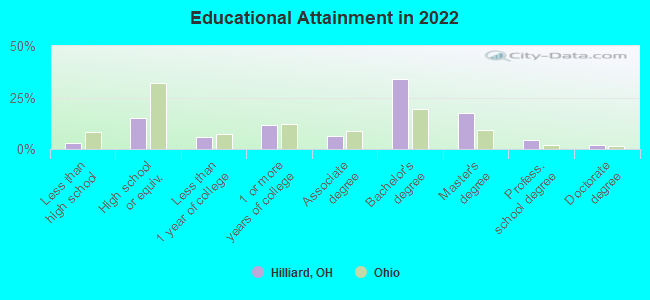
For population 25 years and over in Hilliard:
- High school or higher: 97.0%
- Bachelor's degree or higher: 57.2%
- Graduate or professional degree: 23.6%
- Unemployed: 1.3%
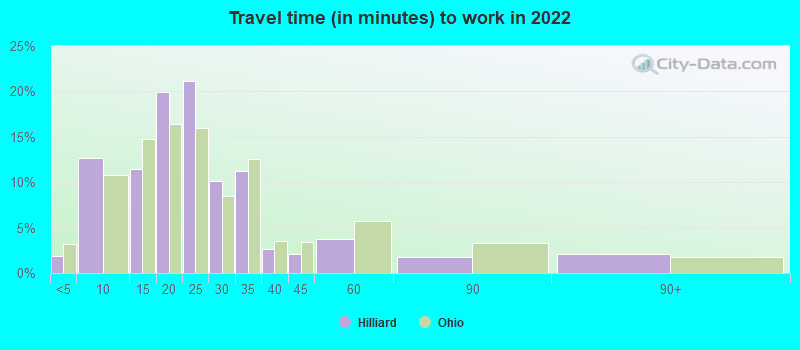
- Mean travel time to work (commute): 18.4 minutes
| Here: | 9.6 |
| Ohio average: | 11.0 |
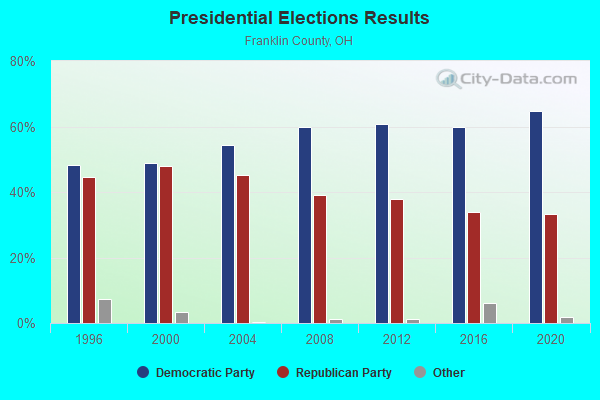
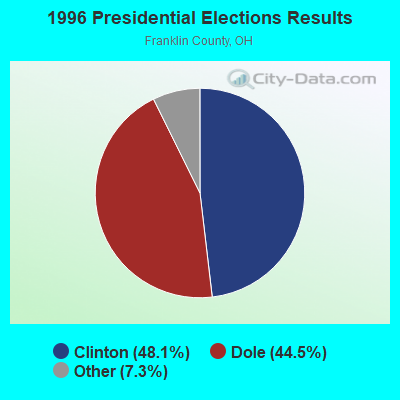
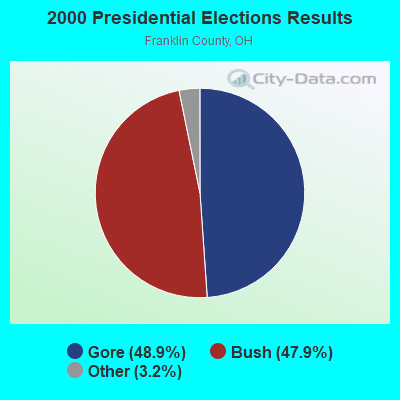
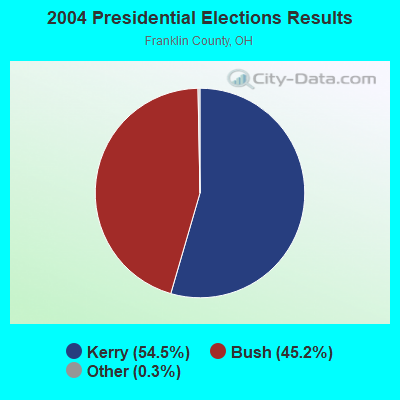
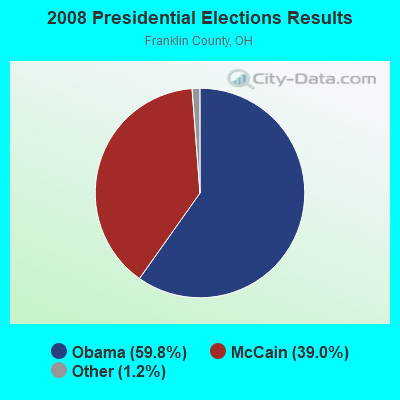
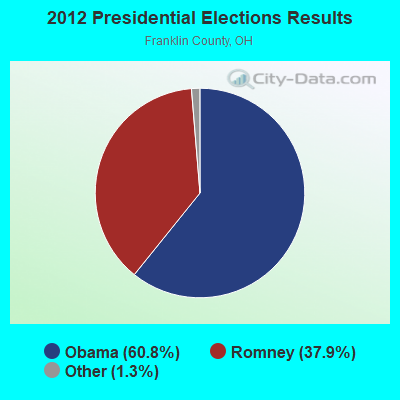
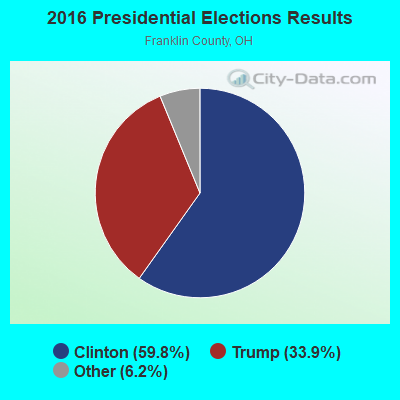
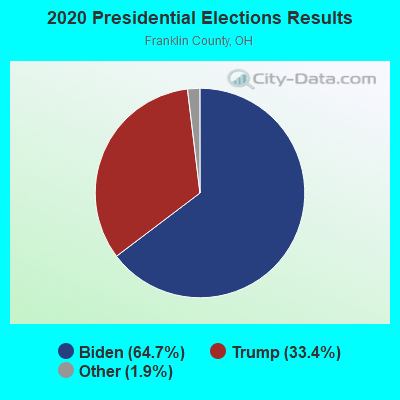
Graphs represent county-level data. Detailed 2008 Election Results
Religion statistics for Hilliard, OH (based on Franklin County data)
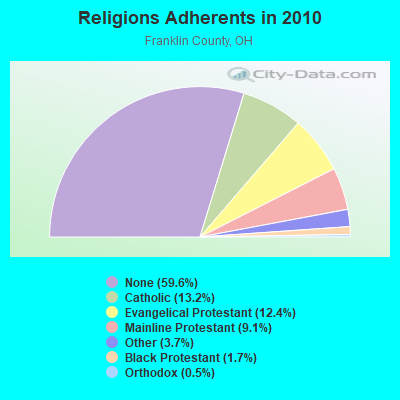
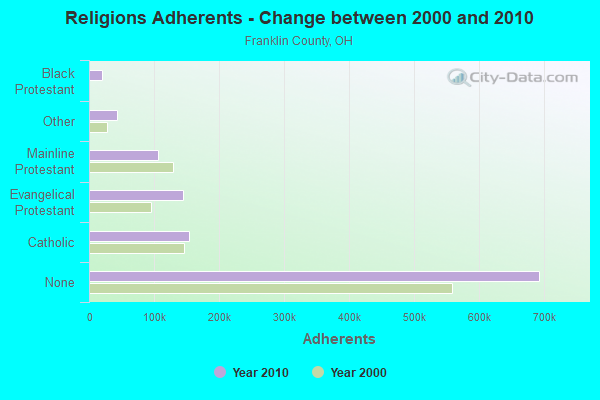
| Religion | Adherents | Congregations |
|---|---|---|
| Catholic | 153,400 | 51 |
| Evangelical Protestant | 144,147 | 462 |
| Mainline Protestant | 105,457 | 230 |
| Other | 42,560 | 102 |
| Black Protestant | 19,363 | 54 |
| Orthodox | 5,360 | 11 |
| None | 693,127 | - |
Food Environment Statistics:
| Franklin County: | 2.25 / 10,000 pop. |
| Ohio: | 1.89 / 10,000 pop. |
| Here: | 0.10 / 10,000 pop. |
| State: | 0.13 / 10,000 pop. |
| This county: | 1.31 / 10,000 pop. |
| Ohio: | 1.25 / 10,000 pop. |
| Franklin County: | 2.55 / 10,000 pop. |
| State: | 2.93 / 10,000 pop. |
| Franklin County: | 6.54 / 10,000 pop. |
| State: | 6.25 / 10,000 pop. |
| Here: | 9.5% |
| Ohio: | 10.3% |
| Franklin County: | 30.2% |
| State: | 29.1% |
| Franklin County: | 13.3% |
| Ohio: | 11.9% |
Health and Nutrition:
| Hilliard: | 53.4% |
| Ohio: | 50.4% |
| Hilliard: | 53.4% |
| Ohio: | 47.8% |
| This city: | 28.0 |
| Ohio: | 28.7 |
| This city: | 20.0% |
| Ohio: | 20.6% |
| Hilliard: | 8.1% |
| Ohio: | 10.4% |
| Hilliard: | 6.9 |
| Ohio: | 6.8 |
| This city: | 32.6% |
| State: | 34.3% |
| Here: | 61.4% |
| Ohio: | 57.0% |
| Here: | 82.4% |
| Ohio: | 79.1% |
More about Health and Nutrition of Hilliard, OH Residents
| Local government employment and payroll (March 2022) | |||||
| Function | Full-time employees | Monthly full-time payroll | Average yearly full-time wage | Part-time employees | Monthly part-time payroll |
|---|---|---|---|---|---|
| Police Protection - Officers | 60 | $543,454 | $108,691 | 0 | $0 |
| Parks and Recreation | 19 | $108,307 | $68,404 | 15 | $13,881 |
| Financial Administration | 13 | $92,433 | $85,323 | 0 | $0 |
| Other Government Administration | 12 | $85,434 | $85,434 | 1 | $1,264 |
| Sewerage | 12 | $63,884 | $63,884 | 0 | $0 |
| Police - Other | 11 | $57,667 | $62,909 | 2 | $628 |
| Streets and Highways | 11 | $69,460 | $75,775 | 0 | $0 |
| Water Supply | 9 | $48,929 | $65,239 | 0 | $0 |
| Other and Unallocable | 6 | $37,481 | $74,962 | 0 | $0 |
| Judicial and Legal | 5 | $31,394 | $75,346 | 1 | $1,468 |
| Natural Resources | 4 | $21,468 | $64,404 | 0 | $0 |
| Housing and Community Development (Local) | 2 | $16,215 | $97,290 | 0 | $0 |
| Totals for Government | 164 | $1,176,127 | $86,058 | 19 | $17,242 |
Hilliard government finances - Expenditure in 2021 (per resident):
- Construction - Parks and Recreation: $1,162,000 ($31.09)
Regular Highways: $355,000 ($9.50)
- Current Operations - Police Protection: $8,538,000 ($228.43)
General - Other: $6,713,000 ($179.60)
Central Staff Services: $3,646,000 ($97.55)
Solid Waste Management: $2,105,000 ($56.32)
Regular Highways: $2,083,000 ($55.73)
Parks and Recreation: $1,722,000 ($46.07)
Financial Administration: $648,000 ($17.34)
Judicial and Legal Services: $437,000 ($11.69)
Protective Inspection and Regulation - Other: $241,000 ($6.45)
Sewerage: $211,000 ($5.65)
Transit Utilities: $30,000 ($0.80)
- General - Interest on Debt: $1,864,000 ($49.87)
- Other Capital Outlay - Parks and Recreation: $143,000 ($3.83)
- Total Salaries and Wages: $12,331,000 ($329.91)
Hilliard government finances - Revenue in 2021 (per resident):
- Charges - Solid Waste Management: $2,561,000 ($68.52)
Other: $2,015,000 ($53.91)
Parks and Recreation: $110,000 ($2.94)
- Local Intergovernmental - Other: $837,000 ($22.39)
General Local Government Support: $379,000 ($10.14)
Highways: $281,000 ($7.52)
- Miscellaneous - General Revenue - Other: $10,340,000 ($276.64)
Interest Earnings: $803,000 ($21.48)
Fines and Forfeits: $224,000 ($5.99)
Donations From Private Sources: $49,000 ($1.31)
Rents: $39,000 ($1.04)
- State Intergovernmental - Highways: $1,869,000 ($50.00)
General Local Government Support: $342,000 ($9.15)
- Tax - Individual Income: $24,408,000 ($653.02)
Corporation Net Income: $5,244,000 ($140.30)
Property: $1,571,000 ($42.03)
Other License: $1,063,000 ($28.44)
Other Selective Sales: $239,000 ($6.39)
Tobacco Products Sales: $1,000 ($0.03)
Hilliard government finances - Debt in 2021 (per resident):
- Long Term Debt - Beginning Outstanding - Unspecified Public Purpose: $58,554,000 ($1566.58)
Outstanding Unspecified Public Purpose: $58,372,000 ($1561.71)
Retired Unspecified Public Purpose: $9,301,000 ($248.84)
Issue, Unspecified Public Purpose: $9,119,000 ($243.97)
Beginning Outstanding - Public Debt for Private Purpose: $6,910,000 ($184.87)
Outstanding Nonguaranteed - Industrial Revenue: $6,910,000 ($184.87)
Hilliard government finances - Cash and Securities in 2021 (per resident):
- Other Funds - Cash and Securities: $61,572,000 ($1647.32)
- Sinking Funds - Cash and Securities: $6,910,000 ($184.87)
5.55% of this county's 2021 resident taxpayers lived in other counties in 2020 ($57,598 average adjusted gross income)
| Here: | 5.55% |
| Ohio average: | 5.68% |
0.01% of residents moved from foreign countries ($105 average AGI)
Franklin County: 0.01% Ohio average: 0.01%
Top counties from which taxpayers relocated into this county between 2020 and 2021:
| from Delaware County, OH | |
| from Fairfield County, OH | |
| from Licking County, OH |
6.60% of this county's 2020 resident taxpayers moved to other counties in 2021 ($69,680 average adjusted gross income)
| Here: | 6.60% |
| Ohio average: | 5.79% |
0.01% of residents moved to foreign countries ($94 average AGI)
Franklin County: 0.01% Ohio average: 0.01%
Top counties to which taxpayers relocated from this county between 2020 and 2021:
| to Delaware County, OH | |
| to Fairfield County, OH | |
| to Licking County, OH |
| Businesses in Hilliard, OH | ||||
| Name | Count | Name | Count | |
|---|---|---|---|---|
| ALDI | 1 | Little Caesars Pizza | 1 | |
| Advance Auto Parts | 2 | Lowe's | 1 | |
| Applebee's | 1 | McDonald's | 2 | |
| Arby's | 2 | Motel 6 | 1 | |
| AutoZone | 1 | Nike | 5 | |
| Blockbuster | 1 | Nissan | 1 | |
| Buffalo Wild Wings | 1 | Old Navy | 1 | |
| Burger King | 2 | Panera Bread | 1 | |
| CVS | 3 | Papa John's Pizza | 1 | |
| Chick-Fil-A | 1 | Payless | 2 | |
| Chipotle | 1 | Pizza Hut | 1 | |
| Circle K | 1 | RadioShack | 1 | |
| Comfort Suites | 1 | Red Robin | 1 | |
| Curves | 1 | Ruby Tuesday | 1 | |
| Dairy Queen | 1 | Sears | 1 | |
| Discount Tire | 2 | Sprint Nextel | 2 | |
| Dressbarn | 1 | Staples | 1 | |
| Famous Footwear | 1 | Starbucks | 2 | |
| FedEx | 6 | Steak 'n Shake | 1 | |
| Firestone Complete Auto Care | 1 | Subway | 3 | |
| GNC | 2 | T-Mobile | 1 | |
| GameStop | 1 | Taco Bell | 2 | |
| H&R Block | 2 | Target | 2 | |
| Hilton | 2 | Tim Hortons | 2 | |
| Home Depot | 1 | U-Haul | 4 | |
| HomeTown Buffet | 1 | UPS | 6 | |
| Jones New York | 1 | Verizon Wireless | 1 | |
| Justice | 1 | Walgreens | 1 | |
| KFC | 2 | Wendy's | 2 | |
| Kohl's | 1 | White Castle | 1 | |
| Kroger | 2 | YMCA | 1 | |
| La-Z-Boy | 1 | |||
Strongest AM radio stations in Hilliard:
- WRFD (880 AM; daytime; 23 kW; COLUMBUS-WORTHINGTON, OH; Owner: SALEM MEDIA OF OHIO, INC.)
- WOSU (820 AM; 5 kW; COLUMBUS, OH; Owner: THE OHIO STATE UNIVERSITY)
- WTVN (610 AM; 50 kW; COLUMBUS, OH; Owner: CITICASTERS LICENSES, L.P.)
- WVKO (1580 AM; 1 kW; COLUMBUS, OH; Owner: ASSOCIATED RADIO, INC.)
- WBNS (1460 AM; 5 kW; COLUMBUS, OH; Owner: RADIOHIO, INCORPORATED)
- WLW (700 AM; 50 kW; CINCINNATI, OH; Owner: JACOR BROADCASTING CORPORATION)
- WCOL (1230 AM; 1 kW; COLUMBUS, OH; Owner: CITICASTERS LICENSES, L.P.)
- WMNI (920 AM; 1 kW; COLUMBUS, OH; Owner: NORTH AMERICAN BROADCASTING CO.)
- WDLR (1550 AM; 4 kW; DELAWARE, OH; Owner: THE FIFTEEN FIFTY CORPORATION)
- WKNR (850 AM; 50 kW; CLEVELAND, OH; Owner: CARON BROADCASTING, INC.)
- WTAM (1100 AM; 50 kW; CLEVELAND, OH; Owner: JACOR BROADCASTING CORPORATION)
- WSAI (1530 AM; 50 kW; CINCINNATI, OH; Owner: JACOR BROADCASTING CORPORATION)
- WWVA (1170 AM; 53 kW; WHEELING, WV; Owner: CAPSTAR TX LIMITED PARTNERSHIP)
Strongest FM radio stations in Hilliard:
- WSNY (94.7 FM; COLUMBUS, OH; Owner: FRANKLIN COMMUNICATIONS, INC.)
- WBZX (99.7 FM; COLUMBUS, OH; Owner: NORTH AMERICAN BROADCASTING CO., INC)
- WBNS-FM (97.1 FM; COLUMBUS, OH; Owner: RADIO OHIO, INC.)
- WXMG (98.9 FM; UPPER ARLINGTON, OH; Owner: BLUE CHIP BROADCASTING LICENSES, LTD)
- WCOL-FM (92.3 FM; COLUMBUS, OH; Owner: CITICASTERS LICENSES, L.P.)
- WLVQ (96.3 FM; COLUMBUS, OH; Owner: INFINITY RADIO OPERATIONS INC.)
- W201AK (88.1 FM; COLUMBUS, OH; Owner: THE CEDARVILLE UNIVERSITY)
- WOSU-FM (89.7 FM; COLUMBUS, OH; Owner: THE OHIO STATE UNIVERSITY)
- WUFM (88.7 FM; COLUMBUS, OH; Owner: SPIRIT COMMUNICATIONS, INC)
- WNCI (97.9 FM; COLUMBUS, OH; Owner: CITICASTERS LICENSES, L.P.)
- WFJX (105.7 FM; HILLIARD, OH; Owner: CITICASTERS LICENSES, L.P.)
- WCBE (90.5 FM; COLUMBUS, OH; Owner: BD.OF EDUC.,CITY SCH.DIST.,COLUMBUS)
- WRVT (88.7 FM; RUTLAND, VT; Owner: VERMONT PUBLIC RADIO)
- WCKX (107.5 FM; COLUMBUS, OH; Owner: BLUE CHIP BROADCASTING LICENSES, LTD)
- W272AT (102.3 FM; COLUMBUS, OH; Owner: INFINITY RADIO SUBSIDIARY OPERATIONS INC.)
- WEGE (103.9 FM; WESTERVILLE, OH; Owner: NORTH AMERICAN BROADCASTING CO. INC.)
- WODB (107.9 FM; DELAWARE, OH; Owner: FRANKLIN COMMUNICATIONS, INC.)
- WWCD (101.1 FM; GROVE CITY, OH; Owner: FUN WITH RADIO, LLC)
- WFCB (93.3 FM; CHILLICOTHE, OH; Owner: CLEAR CHANNEL BROADCASTING LICENSES, INC.)
- WJZK (104.3 FM; RICHWOOD, OH; Owner: SCANTLAND BROADCASTING LTD)
TV broadcast stations around Hilliard:
- WBNS-TV (Channel 10; COLUMBUS, OH; Owner: WBNS-TV, INC.)
- WCMH-TV (Channel 4; COLUMBUS, OH; Owner: OUTLET BROADCASTING, INC.)
- WSYX (Channel 6; COLUMBUS, OH; Owner: WSYX LICENSEE, INC.)
- WTTE (Channel 28; COLUMBUS, OH; Owner: COLUMBUS (WTTE-TV) LICENSEE, INC.)
- WCLL-LP (Channel 19; COLUMBUS, OH; Owner: JONATHAN W. OWENS)
- WDEM-LP (Channel 17; COLUMBUS, OH; Owner: TRIPLETT & ASSOCIATES, INC.)
- WINJ-LP (Channel 8; COLUMBUS, OH; Owner: THE NEW LIFE FELLOWSHIP OF CHURCHES)
- WOSU-TV (Channel 34; COLUMBUS, OH; Owner: THE OHIO STATE UNIVERSITY)
- W43BZ (Channel 43; COLUMBUS, OH; Owner: VENTANA TELEVISION, INC.)
- W23BZ (Channel 23; COLUMBUS, OH; Owner: NATIONAL MINORITY T.V., INC.)
- WWHO (Channel 53; CHILLICOTHE, OH; Owner: UPN STATIONS GROUP INC.)
- WCPX-LP (Channel 48; COLUMBUS, OH; Owner: PAXSON COMMUNICATIONS LICENSE COMPANY, LLC)
- WBDT (Channel 26; SPRINGFIELD, OH; Owner: ACME TV LICENSES OF OHIO, LLC)
- WXCB-LP (Channel 42; DELAWARE, OH; Owner: CENTRAL OHIO ASSOCIATION OF CHRISTIAN BROADCASTERS)
- National Bridge Inventory (NBI) Statistics
- 29Number of bridges
- 269ft / 82.2mTotal length
- 664,021Total average daily traffic
- 78,773Total average daily truck traffic
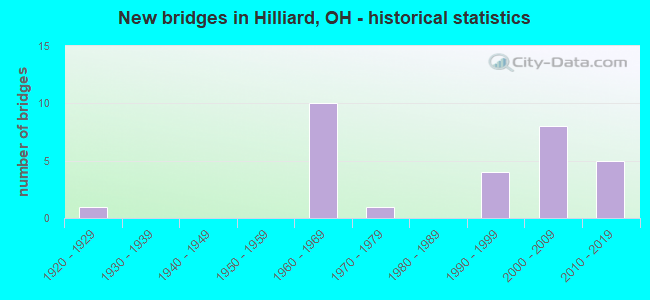
- New bridges - historical statistics
- 11920-1929
- 101960-1969
- 11970-1979
- 41990-1999
- 82000-2009
- 52010-2019
FCC Registered Private Land Mobile Towers: 3 (See the full list of FCC Registered Private Land Mobile Towers in Hilliard, OH)
FCC Registered Broadcast Land Mobile Towers: 30 (See the full list of FCC Registered Broadcast Land Mobile Towers)
FCC Registered Microwave Towers: 16 (See the full list of FCC Registered Microwave Towers in this town)
FCC Registered Paging Towers: 3 (See the full list of FCC Registered Paging Towers)
FCC Registered Amateur Radio Licenses: 241 (See the full list of FCC Registered Amateur Radio Licenses in Hilliard)
FAA Registered Aircraft: 22 (See the full list of FAA Registered Aircraft in Hilliard)
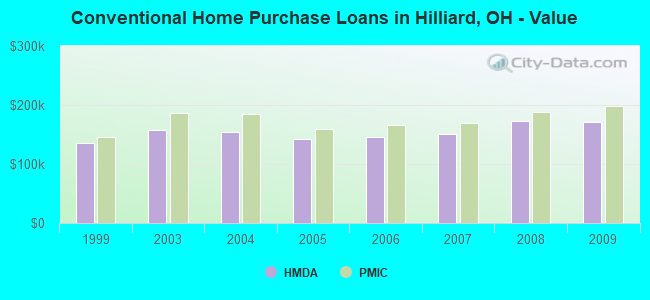
| Home Mortgage Disclosure Act Aggregated Statistics For Year 2009 (Based on 2 full and 5 partial tracts) | ||||||||||||
| A) FHA, FSA/RHS & VA Home Purchase Loans | B) Conventional Home Purchase Loans | C) Refinancings | D) Home Improvement Loans | E) Loans on Dwellings For 5+ Families | F) Non-occupant Loans on < 5 Family Dwellings (A B C & D) | |||||||
|---|---|---|---|---|---|---|---|---|---|---|---|---|
| Number | Average Value | Number | Average Value | Number | Average Value | Number | Average Value | Number | Average Value | Number | Average Value | |
| LOANS ORIGINATED | 195 | $168,250 | 215 | $171,171 | 871 | $170,274 | 21 | $71,429 | 2 | $4,231,630 | 35 | $113,899 |
| APPLICATIONS APPROVED, NOT ACCEPTED | 8 | $161,484 | 12 | $199,123 | 73 | $166,579 | 9 | $24,674 | 0 | $0 | 2 | $87,830 |
| APPLICATIONS DENIED | 20 | $151,110 | 14 | $132,491 | 207 | $187,446 | 12 | $24,106 | 0 | $0 | 8 | $108,158 |
| APPLICATIONS WITHDRAWN | 21 | $151,914 | 17 | $145,085 | 129 | $179,425 | 4 | $57,665 | 0 | $0 | 5 | $102,248 |
| FILES CLOSED FOR INCOMPLETENESS | 4 | $160,715 | 4 | $169,590 | 38 | $166,597 | 0 | $0 | 0 | $0 | 1 | $120,300 |
Detailed HMDA statistics for the following Tracts: 0079.21 , 0079.22, 0079.31, 0079.32, 0079.33, 0079.51, 0079.52
| Private Mortgage Insurance Companies Aggregated Statistics For Year 2009 (Based on 2 full and 5 partial tracts) | ||||
| A) Conventional Home Purchase Loans | B) Refinancings | |||
|---|---|---|---|---|
| Number | Average Value | Number | Average Value | |
| LOANS ORIGINATED | 50 | $197,719 | 42 | $193,588 |
| APPLICATIONS APPROVED, NOT ACCEPTED | 10 | $242,010 | 14 | $216,807 |
| APPLICATIONS DENIED | 6 | $197,273 | 9 | $237,402 |
| APPLICATIONS WITHDRAWN | 5 | $158,878 | 3 | $253,767 |
| FILES CLOSED FOR INCOMPLETENESS | 0 | $0 | 0 | $0 |
Detailed PMIC statistics for the following Tracts: 0079.21 , 0079.22, 0079.31, 0079.32, 0079.33, 0079.51, 0079.52

2002 - 2018 National Fire Incident Reporting System (NFIRS) incidents
- Fire incident types reported to NFIRS in Hilliard, OH
- 68245.5%Structure Fires
- 49332.9%Outside Fires
- 30420.3%Mobile Property/Vehicle Fires
- 211.4%Other
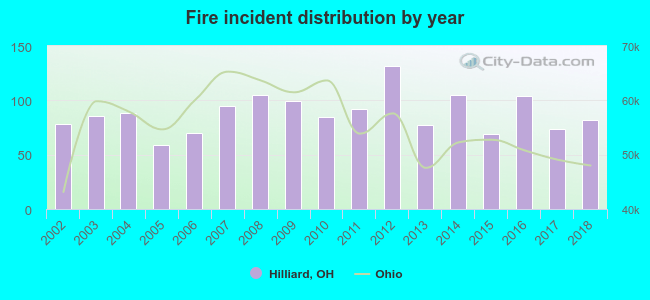 According to the data from the years 2002 - 2018 the average number of fires per year is 88. The highest number of fire incidents - 132 took place in 2012, and the least - 59 in 2005. The data has a rising trend.
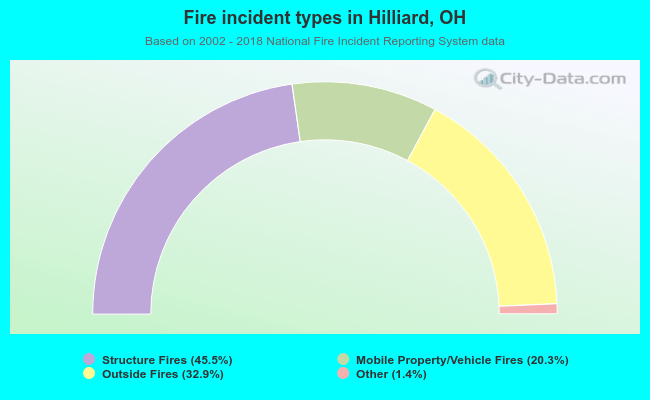 When looking into fire subcategories, the most reports belonged to: Structure Fires (45.5%), and Outside Fires (32.9%).
| Most common first names in Hilliard, OH among deceased individuals | ||
| Name | Count | Lived (average) |
|---|---|---|
| Mary | 111 | 79.2 years |
| Robert | 104 | 71.1 years |
| John | 88 | 71.8 years |
| James | 87 | 74.2 years |
| Charles | 67 | 72.9 years |
| William | 66 | 75.1 years |
| Helen | 57 | 80.1 years |
| Richard | 45 | 70.8 years |
| Margaret | 42 | 83.1 years |
| Dorothy | 42 | 78.3 years |
| Most common last names in Hilliard, OH among deceased individuals | ||
| Last name | Count | Lived (average) |
|---|---|---|
| Smith | 34 | 76.0 years |
| Miller | 29 | 79.5 years |
| Johnson | 23 | 76.4 years |
| Davis | 21 | 72.6 years |
| Williams | 20 | 74.1 years |
| Brown | 19 | 79.6 years |
| Moore | 17 | 80.4 years |
| Jones | 15 | 73.3 years |
| Walker | 13 | 79.1 years |
| King | 13 | 73.5 years |
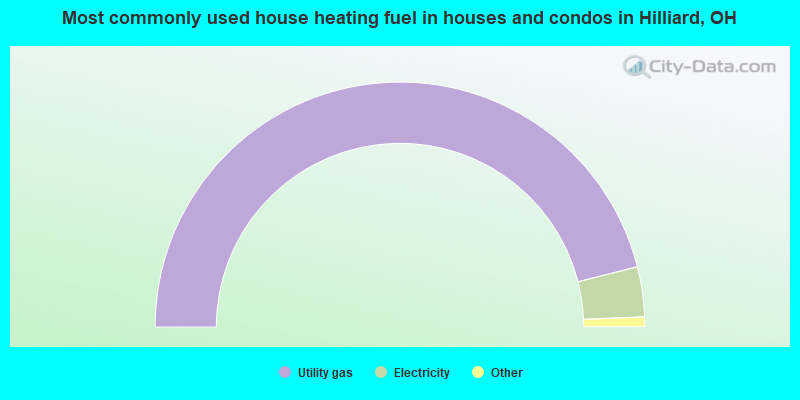
- 92.0%Utility gas
- 6.6%Electricity
- 0.9%Bottled, tank, or LP gas
- 0.2%Fuel oil, kerosene, etc.
- 0.1%Solar energy
- 0.1%No fuel used
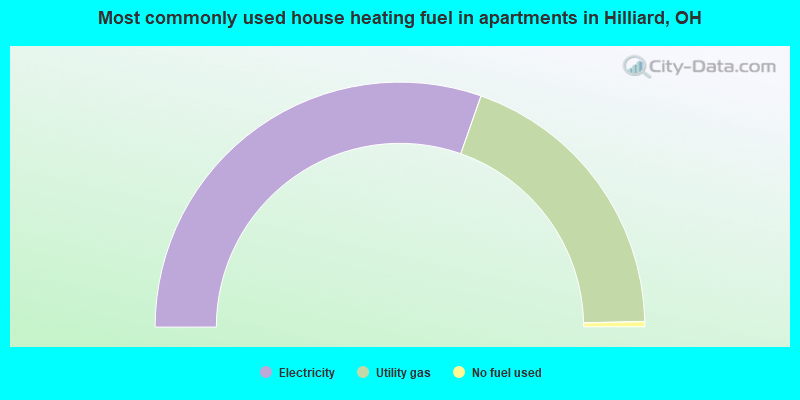
- 60.7%Electricity
- 38.5%Utility gas
- 0.7%No fuel used
Hilliard compared to Ohio state average:
- Median household income above state average.
- Median house value above state average.
- Unemployed percentage significantly below state average.
- Black race population percentage below state average.
- Median age below state average.
- Foreign-born population percentage significantly above state average.
- Renting percentage below state average.
- Length of stay since moving in above state average.
- House age significantly below state average.
- Percentage of population with a bachelor's degree or higher significantly above state average.
Hilliard on our top lists:
- #6 on the list of "Top 101 cities with the most local government spending on highway construction per resident (population 10,000+)"
- #10 on the list of "Top 101 counties with the most Mainline Protestant adherents"
- #13 on the list of "Top 101 counties with the most Mainline Protestant congregations"
- #24 on the list of "Top 101 counties with the highest Particulate Matter (PM10) Annual air pollution readings in 2012 (µg/m3)"
- #25 on the list of "Top 101 counties with the highest number of infant deaths per 1000 residents 2007-2013 (pop. 50,000+)"
- #31 on the list of "Top 101 counties with the highest surface withdrawal of fresh water for public supply (pop. 50,000+)"

|
|
Total of 553 patent applications in 2008-2024.