Hilliard: Fire Incidents, Ohio (OH)
Where are fire incidents reported in Hilliard, OH
Something went wrong! Please refresh the page.
| Fire incidents reported | |
|---|---|
| Sreet name | Count |
| CEMETERY ROAD | 102 |
| BRITTON PARKWAY | 58 |
| LEAP ROAD | 58 |
| TRUEMAN BOULEVARD | 54 |
| SCIOTO DARBY ROAD | 50 |
| MAIN STREET | 46 |
| I-270 | 34 |
| I270 | 32 |
| JEANNETTE ROAD | 30 |
| ROBERTS ROAD | 30 |
| DAVIDSON ROAD | 28 |
| DAVIS ROAD | 28 |
| LYMAN DRIVE | 28 |
| MAIN ST | 26 |
| SCIOTO DARBY RD | 26 |
| HILLIARD ROME RD | 24 |
| LEAP RD | 24 |
| PARKWAY LANE | 24 |
| NORTHWEST PARKWAY | 22 |
| CEMETERY RD | 18 |
| CIRCLE DRIVE | 18 |
| COSGRAY ROAD | 18 |
| DUBLIN RD | 18 |
| DUBLIN ROAD | 18 |
| HAYDEN RUN RD | 18 |
| HAYDEN RUN ROAD | 18 |
| WAYNE STREET | 18 |
| AVERY ROAD | 16 |
| HILLIARD ROME ROAD | 16 |
| LACON ROAD | 16 |
| Other | 584 |
2002 - 2018 National Fire Incident Reporting System (NFIRS) incidents
- Incident types reported to NFIRS in Hilliard, OH
- 2,06721.5%Hazardous Condition
- 1,92420.0%Good Intent Call
- 1,72517.9%False Alarm
- 1,50015.6%Fire
- 1,35514.1%Rescue & EMS
- 97210.1%Service Call
- 310.3%Overpressure Rupture
- 310.3%Severe Weather
- 140.1%Special Incident
- Fire incident types reported to NFIRS in Hilliard, OH
- 68245.5%Structure Fires
- 49332.9%Outside Fires
- 30420.3%Mobile Property/Vehicle Fires
- 211.4%Other
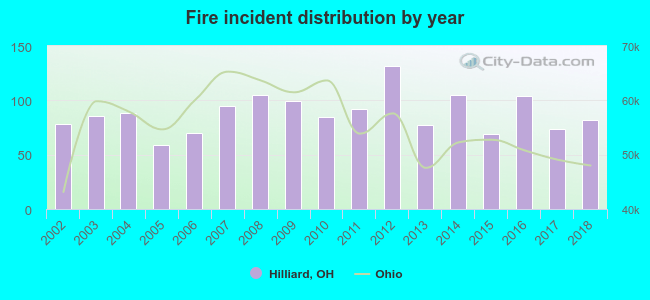 According to the data from the years 2002 - 2018 the average number of fires per year is 88. The highest number of reported fire incidents - 132 took place in 2012, and the least - 59 in 2005. The data has a rising trend.
The average number of yearly fire incidents per 10k residents in Hilliard, OH compared to nearest cities:
(Note: Based on data for the last 3 years, including only cities with population 5,000 and above)
| Hilliard: | 26.7 |
| Upper Arlington: | 17.7 |
| Dublin: | 22.9 |
| Grandview Heights: | 16.1 |
| Worthington: | 24.6 |
| Columbus: | 38.2 |
| Powell: | 33.0 |
| Grove City: | 17.6 |
| Bexley: | 9.6 |
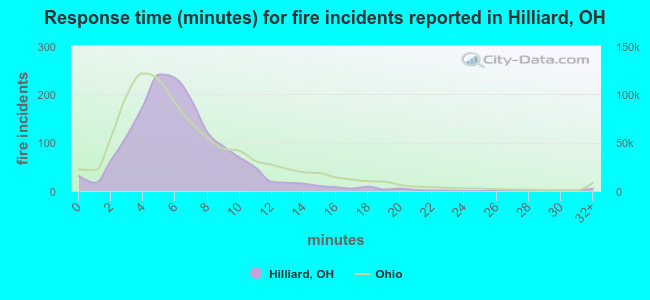 The median response time based on all reported fire incidents is 6 minutes. This is comparable to the Ohio median value.
The median response time in Hilliard, OH compared to nearest cities:
(Note: Based on data for all years, including only cities with at least 500 fire incidents)
| Hilliard: | 6 minutes |
| Upper Arlington: | 5 minutes |
| Dublin: | 5 minutes |
| Worthington: | 4 minutes |
| Plain City: | 8 minutes |
| Columbus: | 4 minutes |
| Powell: | 6 minutes |
| West Jefferson: | 8 minutes |
| Grove City: | 5 minutes |
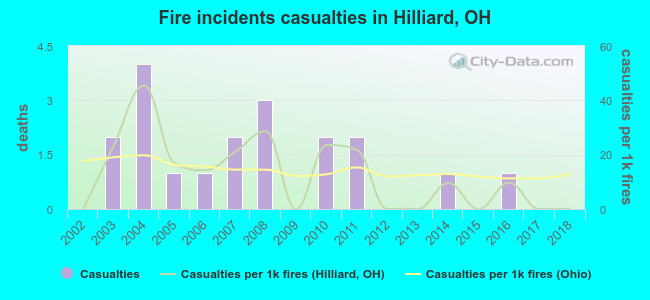 According to the reports from the years 2002 - 2018 the average number of fire-related casualties per year is 1. The highest number of reported injuries - 4 took place in 2004, and the lowest - 0 in 2002. The data has a constant trend.
The average number of injuries per 1,000 fires is 13. This indicator was the highest - 45 in 2004, and the lowest 0 in 2002. The trend for casualties per 1,000 incidents is constant. Compared to the state value the number of casualties per 1,000 fire incidents is similar.
According to the reports from the years 2002 - 2018 the average number of fire-related casualties per year is 1. The highest number of reported injuries - 4 took place in 2004, and the lowest - 0 in 2002. The data has a constant trend.
The average number of injuries per 1,000 fires is 13. This indicator was the highest - 45 in 2004, and the lowest 0 in 2002. The trend for casualties per 1,000 incidents is constant. Compared to the state value the number of casualties per 1,000 fire incidents is similar.Casualties per 1,000 incidents in Hilliard, OH compared to nearest cities:
(Note: Based on data for all years, including only cities with at least 500 fire incidents)
| Hilliard: | 12.7 |
| Upper Arlington: | 15.7 |
| Dublin: | 2.4 |
| Worthington: | 10.2 |
| Plain City: | 5.5 |
| Columbus: | 13.4 |
| Powell: | 11.1 |
| West Jefferson: | 9.7 |
| Grove City: | 14.1 |
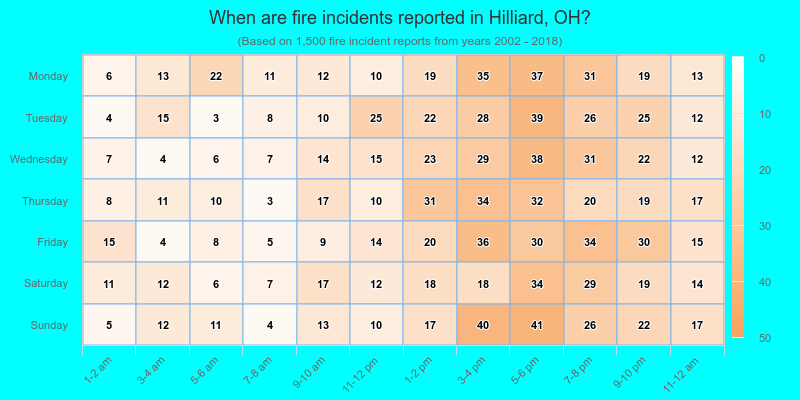
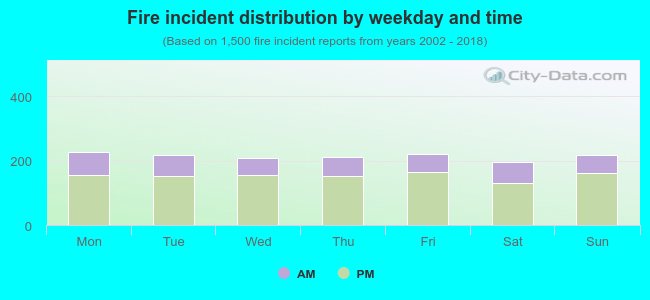 28.4% incidents where reported in the morning and 71.6% in the evening. The most fires (15.2%) took place on Monday, and the least (13.1%) on Saturday.
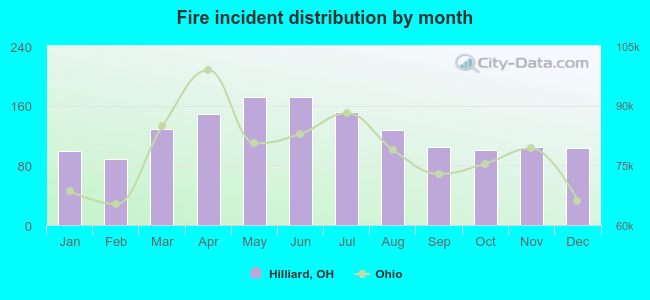 Based on the 1,500 incident reports from years 2002 - 2018 most fires (11.5%) took place during June, and the least (5.9%) in February.
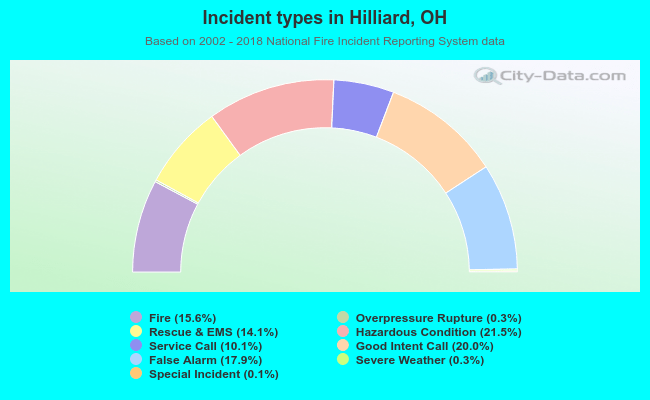 Out of all 9,619 cases reported during the years 2002 - 2018, the most belonged to the categories: Hazardous Condition (21.5%), Good Intent Call (20.0%), and False Alarm (17.9%).
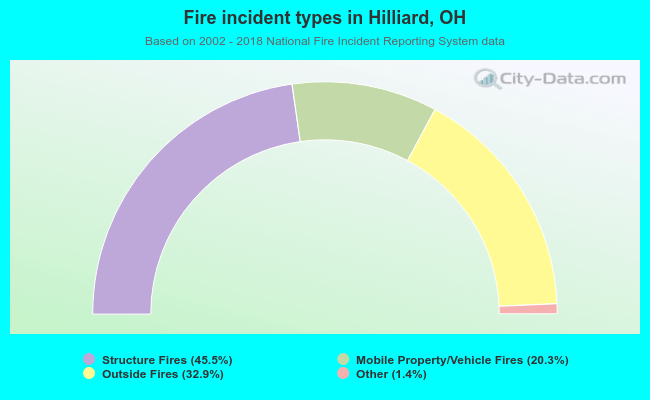 When looking into fire subcategories, the most incidents belonged to: Structure Fires (45.5%), and Outside Fires (32.9%).