Hilliard, OH (Ohio) Houses and Residents
| Hilliard: | $386,793 |
| Ohio: | $204,100 |
Mean price in 2022:
Detached houses: $346,689
Here: $346,689 State: $254,366 Townhouses or other attached units: $246,256
Here: $246,256 State: $225,733 In 2-unit structures: $337,743
Here: $337,743 State: $144,384 In 3-to-4-unit structures: $237,037
Here: $237,037 State: $203,002
Total population: 32,465 (Urban population: 23,879, Rural population: 307 (all nonfarm))
Houses: 14,714 (14,175 occupied: 10,008 owner occupied, 4,077 renter occupied)
| % of renters here: | 29% |
| State: | 33% |
Housing density: 1,321 houses/condos per square mile
Median price asked for vacant for-sale houses and condos in 2022 in this county: $157,288.
Median contract rent in 2022: $1,325 (lower quartile is $1,085, upper quartile is $1,769)
Median rent asked for vacant for-rent units in 2022: $3,151
Median gross rent in Hilliard, OH in 2022: $1,573
Housing units in Hilliard with a mortgage: 7,179 (1,181 second mortgage, 24 home equity loan, 1,119 both second mortgage and home equity loan)
Houses without a mortgage: 518
Median household income for houses/condos with a mortgage: $146,087
Median household income for apartments without a mortgage: $116,553
Median monthly housing costs: $1,786
Compare current foreclosures in Hilliard, OH:
| Photo | Address | Area | Beds / Baths | Price | Details |
|---|---|---|---|---|---|

|
#1
Nike Dr
Hilliard, OH 43026
|
1,668 sq. feet
|
3 baths 3 beds |
show details | |

|
#2
Rutgers Ln
Hilliard, OH 43026
|
832 sq. feet
|
1 baths 2 beds |
show details | |

|
#3
Patcon Way
Hilliard, OH 43026
|
1,280 sq. feet
|
2 baths 3 beds |
show details | |

|
#4
Stoneybrook Blvd
Hilliard, OH 43026
|
1,031 sq. feet
|
2 baths 3 beds |
show details | |

|
#5
Heritage Farms Dr
Hilliard, OH 43026
|
2,180 sq. feet
|
4 baths 4 beds |
show details | |

|
#6
Heritage Lakes Dr
Hilliard, OH 43026
|
3,895 sq. feet
|
5 baths 4 beds |
show details | |

|
#7
Fairway Commons Dr
Hilliard, OH 43026
|
2,654 sq. feet
|
3 baths 3 beds |
show details | |

|
#8
Silo Ct
Hilliard, OH 43026
|
2,865 sq. feet
|
4 baths 4 beds |
show details | |

|
#9
Redlands Dr
Hilliard, OH 43026
|
1,542 sq. feet
|
3 baths 3 beds |
show details | |

|
#10
Valencia Park Blvd
Hilliard, OH 43026
|
1,024 sq. feet
|
2 baths 2 beds |
show details |
| Photo | Address | Area | Beds / Baths | Price | Details |
|---|---|---|---|---|---|

|
#11
Snow Dr
Hilliard, OH 43026
|
1,024 sq. feet
|
2 baths 3 beds |
show details | |

|
#12
Hobbes Dr
Hilliard, OH 43026
|
832 sq. feet
|
1 baths 2 beds |
show details | |

|
#13
Meadowsview Ln
Hilliard, OH 43026
|
2,972 sq. feet
|
4 baths 4 beds |
show details | |

|
#14
Singleton Dr
Hilliard, OH 43026
|
839 sq. feet
|
1 baths 2 beds |
show details | |

|
#15
Westrock Dr
Hilliard, OH 43026
|
1,819 sq. feet
|
3 baths 3 beds |
show details | |

|
#16
Paxton Dr
Hilliard, OH 43026
|
900 sq. feet
|
1 baths 3 beds |
show details | |

|
#17
Scioto Darby Rd
Hilliard, OH 43026
|
1,152 sq. feet
|
2 baths 3 beds |
show details | |

|
#18
Canehill Ln
Hilliard, OH 43026
|
1,152 sq. feet
|
3 baths 2 beds |
show details | |

|
#19
Holland Dr
Hilliard, OH 43026
|
832 sq. feet
|
2 baths 2 beds |
show details | |

|
#20
Marilyn St
Hilliard, OH 43026
|
1,944 sq. feet
|
3 baths 3 beds |
show details |
| Photo | Address | Area | Beds / Baths | Price | Details |
|---|---|---|---|---|---|

|
#21
Pleasant Hill Dr
Hilliard, OH 43026
|
2,204 sq. feet
|
3 baths 4 beds |
show details | |

|
#22
Nadine Park Dr
Hilliard, OH 43026
|
2,890 sq. feet
|
3 baths 4 beds |
show details | |

|
#23
Walborn Dr
Hilliard, OH 43026
|
1,826 sq. feet
|
2 baths 4 beds |
show details | |

|
#24
Westrock Dr
Hilliard, OH 43026
|
1,624 sq. feet
|
2 baths 4 beds |
show details | |

|
#25
Edgewyn Ave
Hilliard, OH 43026
|
900 sq. feet
|
1 baths 3 beds |
show details | |

|
#26
Earman Dr
Hilliard, OH 43026
|
1,766 sq. feet
|
2 baths 4 beds |
show details | |

|
#27
Bressler Dr
Hilliard, OH 43026
|
1,708 sq. feet
|
1 baths 4 beds |
show details | |

|
#28
Mango Ln
Hilliard, OH 43026
|
1,024 sq. feet
|
1 baths 2 beds |
show details | |

|
#29
Hillcrest St N
Hilliard, OH 43026
|
1,565 sq. feet
|
2 baths 3 beds |
show details | |

|
#30
Mengel Ln
Hilliard, OH 43026
|
1,548 sq. feet
|
1 baths 3 beds |
show details |
| Photo | Address | Area | Beds / Baths | Price | Details |
|---|---|---|---|---|---|

|
#31
Ridgebury Dr
Hilliard, OH 43026
|
832 sq. feet
|
1 baths 2 beds |
show details | |

|
#32
Coventry Manor Way
Hilliard, OH 43026
|
1,485 sq. feet
|
2 baths 2 beds |
show details | |

|
#33
Mango Ln
Hilliard, OH 43026
|
1,024 sq. feet
|
1 baths 2 beds |
show details | |

|
#34
Westbriar Dr
Hilliard, OH 43026
|
2,700 sq. feet
|
2 baths 4 beds |
show details | |

|
#35
Darbyshire Dr
Hilliard, OH 43026
|
1,775 sq. feet
|
2 baths 3 beds |
show details | |

|
#36
Dayspring Dr
Hilliard, OH 43026
|
2,226 sq. feet
|
2 baths 4 beds |
show details | |

|
#37
Wyandot Pl
Hilliard, OH 43026
|
972 sq. feet
|
1 baths 3 beds |
show details | |

|
#38
Stonesthrow Ct W
Hilliard, OH 43026
|
2,128 sq. feet
|
2 baths 3 beds |
show details | |

|
#39
Jupiter Ave
Hilliard, OH 43026
|
1,320 sq. feet
|
1 baths 3 beds |
show details | |

|
#40
Lonerise Ln
Hilliard, OH 43026
|
1,622 sq. feet
|
2 baths 3 beds |
show details |
| Photo | Address | Area | Beds / Baths | Price | Details |
|---|---|---|---|---|---|

|
#41
Stoneybrook B 21a
Hilliard, OH 43026
|
1,031 sq. feet
|
1 baths 3 beds |
show details | |

|
#42
Edgewyn Ave
Hilliard, OH 43026
|
900 sq. feet
|
1 baths 3 beds |
show details | |

|
#43
Leybourne Dr
Hilliard, OH 43026
|
1,632 sq. feet
|
2 baths 3 beds |
show details | |

|
#44
Stoneybrook Blvd
Hilliard, OH 43026
|
1,031 sq. feet
|
1 baths 3 beds |
show details | |

|
#45
Messner Dr
Hilliard, OH 43026
|
832 sq. feet
|
1 baths 2 beds |
show details | |

|
#46
Shelby Ln
Hilliard, OH 43026
|
1,464 sq. feet
|
2 baths 3 beds |
show details | |

|
#47
Bigelow Dr
Hilliard, OH 43026
|
1,206 sq. feet
|
1 baths 3 beds |
show details | |

|
#48
Nike Dr
Hilliard, OH 43026
|
1,560 sq. feet
|
1 baths 3 beds |
show details | |

|
#49
Jeffey Dr
Hilliard, OH 43026
|
1,996 sq. feet
|
2 baths 4 beds |
show details | |

|
Check over 1 million property listings on Foreclosure.com!
|
browse all offers | |||

Latest news about housing in Hilliard, OH collected exclusively by city-data.com from local newspapers, TV, and radio stations

 | Townhomes or Apartments Dublin/Hilliard Area (6 replies) |
| Where should I buy a house/condo around here? (84 replies) |
| Where do affordable houses move fastest? (8 replies) |
| Relocating - suggestions on kid-friendly apartments in Columbus area? (5 replies) |
| Need opinions on homes built in 90s (14 replies) |
| Apartments in Columbus = All the same (25 replies) |

Median year apartment built: 2012
Household type by relationship:
Households: 36,203- Male householders: 6,932 (1,399 living alone), Female householders: 6,993 (1,816 living alone)
8,325 spouses (8,301 opposite-sex spouses), 861 unmarried partners, (852 opposite-sex unmarried partners), 11,771 children (10,874 natural, 377 adopted, 520 stepchildren), 186 grandchildren, 153 brothers or sisters, 352 parents, 0 foster children, 65 other relatives, 361 non-relatives
- In group quarters: 200
Size of family households: 4,201 2-persons, 2,328 3-persons, 1,914 4-persons, 1,021 5-persons, 260 6-persons, 112 7-or-more-persons.
Size of nonfamily households: 3,356 1-person, 674 2-persons, 28 3-persons, 13 4-persons.
7,401 married couples with children.
1,637 single-parent households (408 men, 1,229 women).
87.5% of residents of Hilliard speak English at home.
2.4% of residents speak Spanish at home (50% speak English very well, 32% speak English well, 10% speak English not well, 8% don't speak English at all).
4.1% of residents speak other Indo-European language at home (65% speak English very well, 19% speak English well, 7% speak English not well, 9% don't speak English at all).
3.2% of residents speak Asian or Pacific Island language at home (53% speak English very well, 32% speak English well, 14% speak English not well).
2.1% of residents speak other language at home (75% speak English very well, 18% speak English well, 6% speak English not well, 1% don't speak English at all).
Foreign born population: 3,669 (10.1%)
(61.8% of them are naturalized citizens)
| Here: | 7.4 |
| State: | 6.7 |
| Here: | 4.0 |
| State: | 4.4 |

- Bedrooms in owner-occupied houses and condos in Hilliard, Ohio
- 0no bedroom
- 151 bedroom
- 9222 bedrooms
- 4,0753 bedrooms
- 4,4054 bedrooms
- 5915+ bedrooms

- Bedrooms in renter-occupied apartments in Hilliard, Ohio
- 309no bedroom
- 9381 bedroom
- 1,9092 bedrooms
- 8603 bedrooms
- 614 bedrooms
- 05+ bedrooms

- Cars and other vehicles available in Hilliard in owner-occupied houses/condos
- 118no vehicle
- 1,7221 vehicle
- 5,4062 vehicles
- 1,8873 vehicles
- 7194 vehicles
- 1575+ vehicles

- Cars and other vehicles available in Hilliard in renter-occupied apartments
- 293no vehicle
- 1,6561 vehicle
- 1,8932 vehicles
- 1683 vehicles
- 674 vehicles
- 05+ vehicles

- Rooms in owner-occupied houses in Hilliard, Ohio
- 01 room
- 02 rooms
- 643 rooms
- 2514 rooms
- 1,3545 rooms
- 1,6466 rooms
- 1,7957 rooms
- 1,4988 rooms
- 3,4009+ rooms

- Rooms in renter-occupied apartments in Hilliard, Ohio
- 1731 room
- 5152 rooms
- 7233 rooms
- 9804 rooms
- 1,0475 rooms
- 3436 rooms
- 1147 rooms
- 1268 rooms
- 579+ rooms


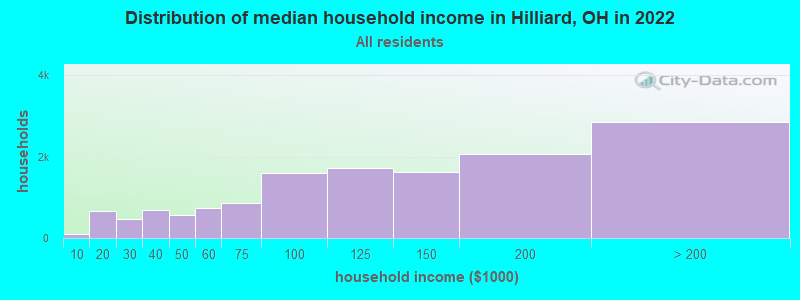
Hilliard, OH household income distribution

- 98Less than $10,000
- 676$10,000 to $19,999
- 478$20,000 to $29,999
- 691$30,000 to $39,999
- 567$40,000 to $49,999
- 733$50,000 to $59,999
- 871$60,000 to $74,999
- 1,594$75,000 to $99,999
- 1,712$100,000 to $124,999
- 1,623$125,000 to $149,999
- 2,073$150,000 to $199,999
- 2,854$200,000 or more
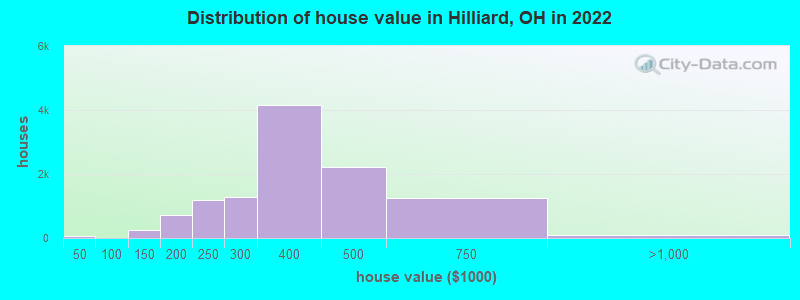
Home value of owner - occupied houses in 2022 in Hilliard, OH
-
- 37Less than $10,000
- 12$25,000 to $29,999
- 5$90,000 to $99,999
- 156$100,000 to $124,999
- 108$125,000 to $149,999
- 441$150,000 to $174,999
- 264$175,000 to $199,999
- 1,174$200,000 to $249,999
- 1,284$250,000 to $299,999
- 4,147$300,000 to $399,999
- 2,204$400,000 to $499,999
- 1,244$500,000 to $749,999
- 52$750,000 to $999,999
- 11$1,000,000 to $1,499,999
- 16$1,500,000 to $1,999,999
Rent paid by renters in 2022 in Hilliard, OH
-
- 7$250 to $299
- 5$400 to $449
- 11$450 to $499
- 10$500 to $549
- 9$550 to $599
- 14$600 to $649
- 45$700 to $749
- 50$750 to $799
- 191$800 to $899
- 393$900 to $999
- 1,247$1,000 to $1,249
- 703$1,250 to $1,499
- 1,580$1,500 to $1,999
- 99$2,000 to $2,499
- 13$2,500 to $2,999
- 100$3,500 or more
- 30No cash rent


Percentage of workers working in this county: 88.0%
Number of people working at home: 4,607 (22.5% of all workers)
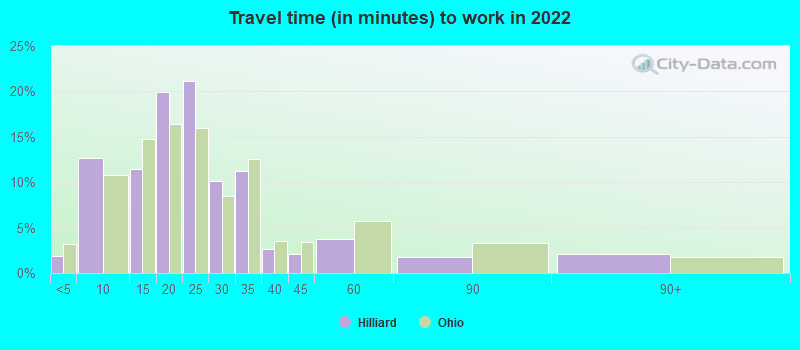
Travel time to work (commute)
- Less than 5 minutes: 140
- 5 to 9 minutes: 2,097
- 10 to 14 minutes: 1,730
- 15 to 19 minutes: 2,298
- 20 to 24 minutes: 3,237
- 25 to 29 minutes: 2,054
- 30 to 34 minutes: 2,323
- 35 to 39 minutes: 317
- 40 to 44 minutes: 471
- 45 to 59 minutes: 601
- 60 to 89 minutes: 242
- 90 or more minutes: 337
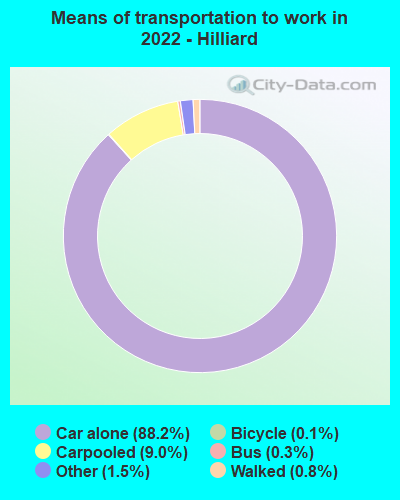
Means of transportation to work:
- Drove a car alone: 13,344 (68.1%)
- Carpooled: 1,607 (8.2%)
- Bus: 48 (0.2%)
- Taxi: 289 (1.5%)
- Bicycle: 21 (0.1%)
- Walked: 103 (0.5%)
- Worked at home: 4,607 (23.5%)

- Unemployment by race in 2022
- Unemployment rate for White non-Hispanic residents
- 2.5%Males
- 1.3%Females
- Unemployment rate for Black residents
- 2.9%Females
- Unemployment rate for Asian residents
- 0.9%Females
- Unemployment rate for two or more race residents
- 1.7%Females

- Year of entry for the foreign-born population in Hilliard, Ohio
- 1,5362010 or later
- 6262000 to 2009
- 9031990 to 1999
- 2761980 to 1989
- 1691970 to 1979
- 75Before 1970

First ancestries reported:
- German: 2,277 (15.3%)
- English: 1,461 (9.8%)
- Irish: 1,356 (9.1%)
- American: 1,183 (8.0%)
- Italian: 657 (4.4%)
- European: 547 (3.7%)
- Polish: 249 (1.7%)
- Egyptian: 224 (1.5%)
- Scotch-Irish: 163 (1.1%)
- Brazilian: 108 (0.7%)
- Slovak: 102 (0.7%)
- Hungarian: 100 (0.7%)
- Pennsylvania German: 95 (0.6%)
- French: 87 (0.6%)
- Welsh: 80 (0.5%)
- Scottish: 76 (0.5%)
- French Canadian: 73 (0.5%)
- Norwegian: 72 (0.5%)
- Turkish: 63 (0.4%)
- Yugoslavian: 62 (0.4%)
- African: 60 (0.4%)
- Dutch: 59 (0.4%)
- Greek: 53 (0.4%)
- Swedish: 52 (0.4%)
- Syrian: 49 (0.3%)
- Ukrainian: 49 (0.3%)
- Iraqi: 46 (0.3%)
- Somali: 44 (0.3%)
- Lebanese: 42 (0.3%)
- Russian: 38 (0.3%)
- British: 37 (0.2%)
- Eastern European: 37 (0.2%)
- Austrian: 30 (0.2%)
- Romanian: 26 (0.2%)
- Palestinian: 20 (0.1%)
- Icelander: 18 (0.1%)
- Bulgarian: 16 (0.1%)
- Slovene: 16 (0.1%)
- Jordanian: 16 (0.1%)
- Northern European: 11 (0.07%)
- Latvian: 10 (0.07%)
- Arab: 10 (0.07%)
- Croatian: 9 (0.06%)
- Scandinavian: 7 (0.05%)
- Iranian: 7 (0.05%)
- Luxembourger: 6 (0.04%)
- Czechoslovakian: 5 (0.03%)
- Armenian: 3 (0.02%)
Most common places of birth for foreign-born residents (%):
| Hilliard: | 20.6% (737) |
| Ohio: | 11.6% (66,525) |
| Hilliard: | 19.4% (694) |
| Ohio: | 1.0% (5,444) |
| Hilliard: | 6.2% (224) |
| Ohio: | 0.7% (3,920) |
| Hilliard: | 5.1% (183) |
| Ohio: | 6.2% (35,703) |
| Hilliard: | 4.7% (167) |
| Ohio: | 0.3% (1,435) |
| Hilliard: | 3.5% (127) |
| Ohio: | 2.2% (12,846) |
| Hilliard: | 3.3% (117) |
| Ohio: | 0.4% (2,052) |
| Hilliard: | 3.2% (116) |
| Ohio: | 0.9% (5,101) |
| Hilliard: | 3.2% (113) |
| Ohio: | 1.9% (10,960) |
| Hilliard: | 3.0% (106) |
| Ohio: | 2.0% (11,398) |
| Hilliard: | 2.6% (93) |
| Ohio: | 0.8% (4,651) |
| Hilliard: | 2.1% (76) |
| Ohio: | 0.3% (1,918) |
| Hilliard: | 2.0% (70) |
| Ohio: | 0.2% (1,013) |
| Hilliard: | 1.9% (69) |
| Ohio: | 0.4% (2,488) |
| Hilliard: | 1.9% (68) |
| Ohio: | 0.2% (1,372) |
| Hilliard: | 1.9% (67) |
| Ohio: | 0.3% (1,897) |
| Hilliard: | 1.7% (61) |
| Ohio: | 0.5% (2,773) |
| Hilliard: | 1.7% (60) |
| Ohio: | 1.7% (9,564) |
Place of birth for U.S.-born residents:
- This state: 23,685
- Other state: 8,383
- Northeast: 2,415
- Midwest: 2,356
- South: 2,665
- West: 981
84.2% of Hilliard residents lived in the same house 1 years ago.
Out of people who lived in different houses, 36.3% lived in this county.
Out of people who lived in different counties, 23.2% lived in Ohio.
| Hilliard: | 84.2% |
| State average: | 87.8% |
Education attainment for males 25 years and older:
- No schooling: 96
- Nursery to 4th grade: 0
- 5th and 6th grade: 0
- 7th and 8th grade: 27
- 9th grade: 109
- 10th grade: 55
- 11th grade: 42
- 12th grade, no diploma: 109
- High school graduate (or equivalency): 1,889
- Less than 1 year of college: 723
- Some college more than 1 year, no degree: 1,709
- Associate degree: 642
- Bachelor's degree: 3,926
- Master's degree: 1,687
- Professional school degree: 649
- Doctorate degree: 321

Education attainment for females 25 years and older:
- No schooling: 41
- Nursery to 4th grade: 45
- 5th and 6th grade: 20
- 7th and 8th grade: 20
- 9th grade: 11
- 10th grade: 41
- 11th grade: 89
- 12th grade, no diploma: 73
- High school graduate (or equivalency): 1,855
- Less than 1 year of college: 660
- Some college more than 1 year, no degree: 1,165
- Associate degree: 936
- Bachelor's degree: 4,437
- Master's degree: 2,626
- Professional school degree: 486
- Doctorate degree: 203


Housing units in structures:
- One, detached: 9,479
- One, attached: 1,730
- Two: 165
- 3 or 4: 660
- 5 to 9: 548
- 10 to 19: 646
- 20 to 49: 693
- 50 or more: 781
- Boats, RVs, vans, etc.: 10
Housing units lacking complete kitchen facilities in 2022: 2.0%
House/condo owner moved in on average 10 years ago
Renter moved in on average 1 years ago

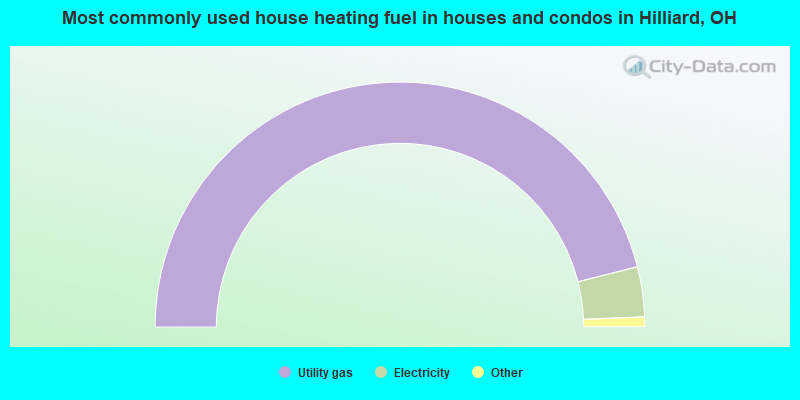
- 92.0%Utility gas
- 6.6%Electricity
- 0.9%Bottled, tank, or LP gas
- 0.2%Fuel oil, kerosene, etc.
- 0.1%Solar energy
- 0.1%No fuel used
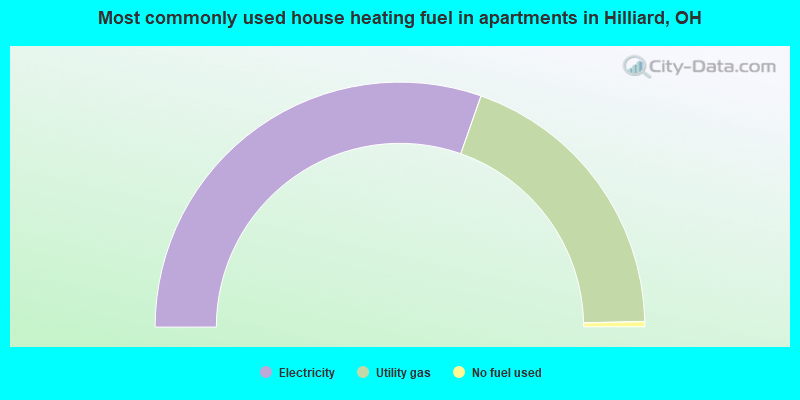
- 60.7%Electricity
- 38.5%Utility gas
- 0.7%No fuel used
Private vs. public school enrollment:
| Here: | 13.3% |
| Ohio: | 16.0% |
| Here: | 6.6% |
| Ohio: | 13.1% |
| Here: | 10.9% |
| Ohio: | 22.3% |


