West Mifflin: Fire Incidents, Pennsylvania (PA)
Where are fire incidents reported in West Mifflin, PA
Something went wrong! Please refresh the page.
| Fire incidents reported | |
|---|---|
| Sreet name | Count |
| LEBANON CHURCH RD | 136 |
| MIDWAY DR | 86 |
| MOUNTAIN VIEW DR | 42 |
| SHARP AVE | 40 |
| CENTURY DR | 36 |
| COMMONWEALTH AVE | 30 |
| KENNYWOOD BLVD | 28 |
| PENNSYLVANIA AVE | 26 |
| CLAIRTON BLVD | 24 |
| GREENSPRINGS AVE | 22 |
| PITTSBURGH MCKEESPORT BLVD | 20 |
| B DR | 16 |
| CLAIRTON / RT. 51 BLVD | 16 |
| NEW ENGLAND RD | 16 |
| BUTTERMILK HOLLOW RD | 14 |
| CLAIRTON RD | 14 |
| IRWIN RUN RD | 14 |
| LEBANON SCHOOL RD | 14 |
| MIDWAY DRIVE DR | 14 |
| STREETS RUN RD | 14 |
| ANNA AVE | 12 |
| HOMESTEAD DUQUESNE RD | 12 |
| WORTON BLVD | 12 |
| ADAMS AVE | 10 |
| BELLWOOD RD | 10 |
| CAMP HOLLOW RD | 10 |
| CLAIRTON / RT. 885 S RD | 10 |
| COAL RD | 10 |
| DUQUESNE AVE | 10 |
| GARFIELD AVE | 10 |
| Other | 44 |
2006 - 2018 National Fire Incident Reporting System (NFIRS) incidents
- Incident types reported to NFIRS in West Mifflin, PA
- 91725.8%Hazardous Condition
- 77221.7%Fire
- 64318.1%False Alarm
- 58216.4%Good Intent Call
- 3038.5%Service Call
- 2687.5%Rescue & EMS
- 471.3%Severe Weather
- 160.4%Special Incident
- 80.2%Overpressure Rupture
- Fire incident types reported to NFIRS in West Mifflin, PA
- 35145.5%Structure Fires
- 20826.9%Outside Fires
- 14819.2%Mobile Property/Vehicle Fires
- 658.4%Other
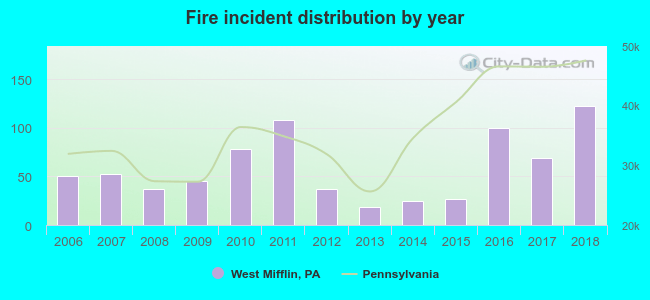 Based on the data from the years 2006 - 2018 the average number of fires per year is 59. The highest number of reported fire incidents - 123 took place in 2018, and the least - 19 in 2013. The data has a growing trend.
The average number of yearly fire incidents per 10k residents in West Mifflin, PA compared to nearest cities:
(Note: Based on data for the last 3 years, including only cities with population 5,000 and above)
| West Mifflin: | 48.2 |
| Munhall: | 46.6 |
| Duquesne: | 61.6 |
| McKeesport: | 43.3 |
| Swissvale: | 58.0 |
| Baldwin: | 16.5 |
| Pleasant Hills: | 3.0 |
| Brentwood: | 24.4 |
| Forest Hills: | 31.9 |
 The median response time based on all reported fire incidents is 7 minutes. This is similar to the Pennsylvania median value.
The median response time in West Mifflin, PA compared to nearest cities:
(Note: Based on data for all years, including only cities with at least 500 fire incidents)
| West Mifflin: | 7 minutes |
| McKeesport: | 5 minutes |
| Clairton: | 6 minutes |
| Pittsburgh: | 4 minutes |
| Monroeville: | 6 minutes |
| Penn Hills: | 7 minutes |
| Irwin: | 5 minutes |
 According to the data from the years 2006 - 2018 the average number of fire-related yearly casualties is 0. The highest number of reported injuries - 1 took place in 2007, and the lowest - 0 in 2006. The data has a rising trend.
The average number of injuries per 1,000 fires is 4. This indicator was the highest - 19 in 2007, and the lowest 0 in 2006. The trend for injuries per 1,000 incidents is rising. Compared to the Pennsylvania value the number of injuries per 1,000 fires is similar.
According to the data from the years 2006 - 2018 the average number of fire-related yearly casualties is 0. The highest number of reported injuries - 1 took place in 2007, and the lowest - 0 in 2006. The data has a rising trend.
The average number of injuries per 1,000 fires is 4. This indicator was the highest - 19 in 2007, and the lowest 0 in 2006. The trend for injuries per 1,000 incidents is rising. Compared to the Pennsylvania value the number of injuries per 1,000 fires is similar.Casualties per 1,000 incidents in West Mifflin, PA compared to nearest cities:
(Note: Based on data for all years, including only cities with at least 500 fire incidents)
| West Mifflin: | 5.2 |
| McKeesport: | 5.2 |
| Clairton: | 0.0 |
| Pittsburgh: | 6.0 |
| Monroeville: | 0.0 |
| Penn Hills: | 3.4 |
| Irwin: | 4.0 |
 30.2% incidents where reported in the morning and 69.8% in the evening. The most fires (16.1%) took place on Sunday, and the least (11.5%) on Wednesday.
 According to the 772 fire incident reports from years 2006 - 2018 most fires (12.4%) took place during June, and the least (6.9%) in March.
 Out of all 3,556 cases reported during the years 2006 - 2018, the most belonged to the categories: Hazardous Condition (25.8%), Fire (21.7%), and False Alarm (18.1%).
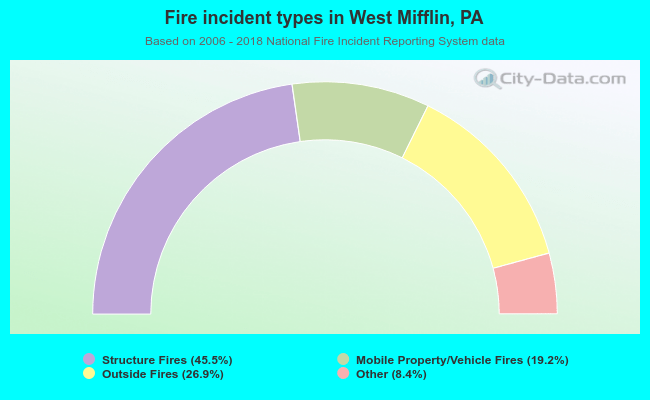 When looking into fire subcategories, the most incidents belonged to: Structure Fires (45.5%), and Outside Fires (26.9%).