Baldwin: Fire Incidents, Pennsylvania (PA)
Where are fire incidents reported in Baldwin, PA
Something went wrong! Please refresh the page.
|
| |||||||||||||||||||||||||||||||||||||||||||||||||||||||||||||||||||||||||||||||||||||||||||||||||||||||||||||
2007 - 2018 National Fire Incident Reporting System (NFIRS) incidents
- Incident types reported to NFIRS in Baldwin, PA
- 12823.3%False Alarm
- 11120.2%Fire
- 9417.1%Hazardous Condition
- 7213.1%Good Intent Call
- 6712.2%Rescue & EMS
- 468.4%Service Call
- 264.7%Severe Weather
- 40.7%Special Incident
- 10.2%Overpressure Rupture
- Fire incident types reported to NFIRS in Baldwin, PA
- 9383.8%Structure Fires
- 76.3%Mobile Property/Vehicle Fires
- 65.4%Other
- 54.5%Outside Fires
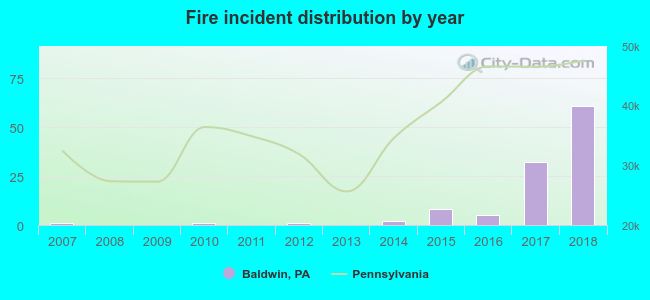 Based on the data from the years 2007 - 2018 the average number of fires per year is 9. The highest number of reported fires - 61 took place in 2018, and the least - 0 in 2008. The data has a rising trend.
The average number of yearly fire incidents per 10k residents in Baldwin, PA compared to nearest cities:
(Note: Based on data for the last 3 years, including only cities with population 5,000 and above)
| Baldwin: | 16.5 |
| Whitehall: | 1.8 |
| Brentwood: | 24.4 |
| Pleasant Hills: | 3.0 |
| Castle Shannon: | 2.8 |
| West Mifflin: | 48.2 |
| Bethel Park: | 12.3 |
| Munhall: | 46.6 |
| Dormont: | 26.6 |

 26.1% incidents where reported in the morning and 73.9% in the evening. The most fires (20.7%) took place on Monday, and the least (6.3%) on Wednesday.
 Based on the 111 reports from years 2007 - 2018 most fires (19.8%) took place during May, and the least (1.8%) in December.
 Out of all 549 cases reported during the years 2007 - 2018, the most belonged to the categories: False Alarm (23.3%), Fire (20.2%), and Hazardous Condition (17.1%).
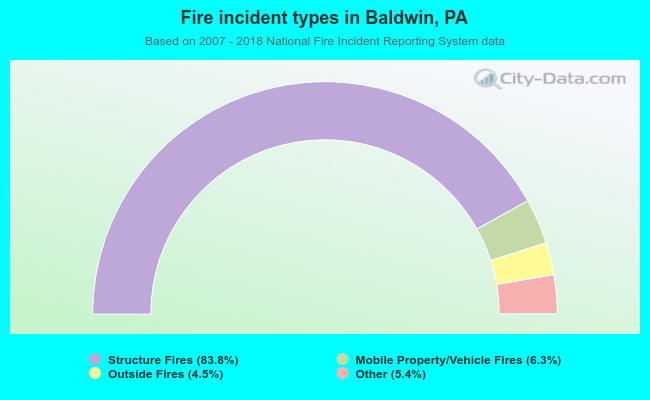 When looking into fire subcategories, the most incidents belonged to: Structure Fires (83.8%), and Mobile Property/Vehicle Fires (6.3%).