Munhall: Fire Incidents, Pennsylvania (PA)
Where are fire incidents reported in Munhall, PA
Something went wrong! Please refresh the page.
|
| |||||||||||||||||||||||||||||||||||||||||||||||||||||||||||||||||||||||||||||||||||||||||||||||||||||||||||||
2006 - 2018 National Fire Incident Reporting System (NFIRS) incidents
- Incident types reported to NFIRS in Munhall, PA
- 39620.7%Fire
- 38920.4%False Alarm
- 34918.3%Hazardous Condition
- 30315.9%Good Intent Call
- 22311.7%Service Call
- 20110.5%Rescue & EMS
- 201.0%Special Incident
- 170.9%Overpressure Rupture
- 110.6%Severe Weather
- Fire incident types reported to NFIRS in Munhall, PA
- 16140.7%Structure Fires
- 15138.1%Other
- 6015.2%Outside Fires
- 246.1%Mobile Property/Vehicle Fires
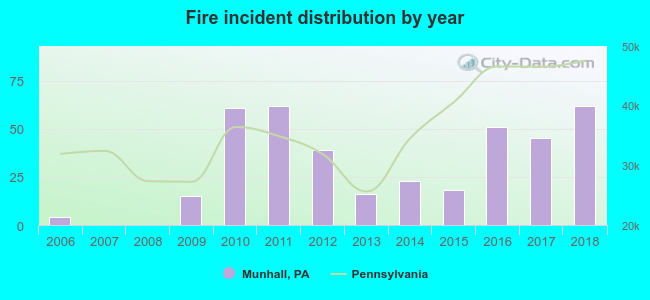 Based on the data from the years 2006 - 2018 the average number of fire incidents per year is 30. The highest number of fire incidents - 62 took place in 2011, and the least - 0 in 2007. The data has an increasing trend.
The average number of yearly fire incidents per 10k residents in Munhall, PA compared to nearest cities:
(Note: Based on data for the last 3 years, including only cities with population 5,000 and above)
| Munhall: | 46.6 |
| West Mifflin: | 48.2 |
| Swissvale: | 58.0 |
| Duquesne: | 61.6 |
| Forest Hills: | 31.9 |
| Wilkinsburg: | 31.6 |
| Brentwood: | 24.4 |
| McKeesport: | 43.3 |
| Baldwin: | 16.5 |
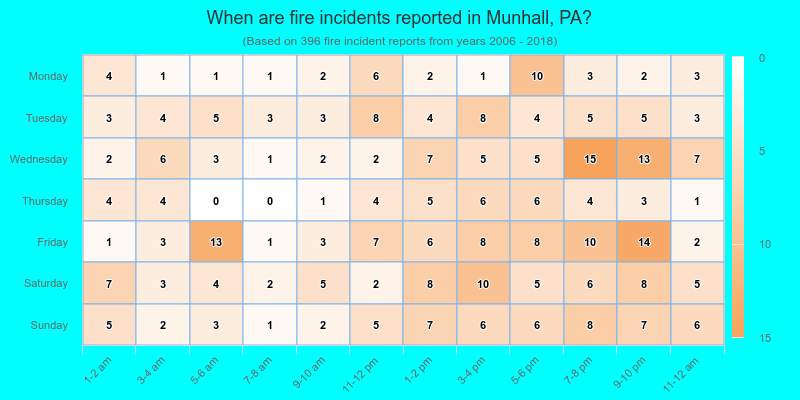
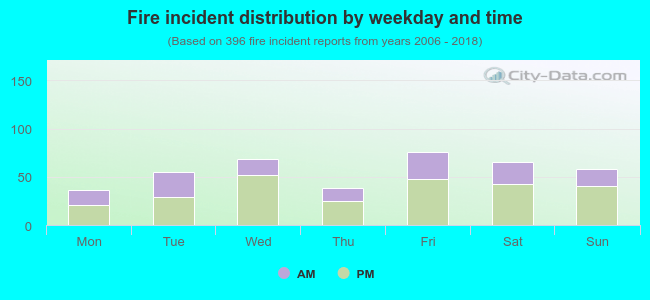 35.1% incidents where reported in the morning and 64.9% in the evening. The most fires (19.2%) took place on Friday, and the least (9.1%) on Monday.
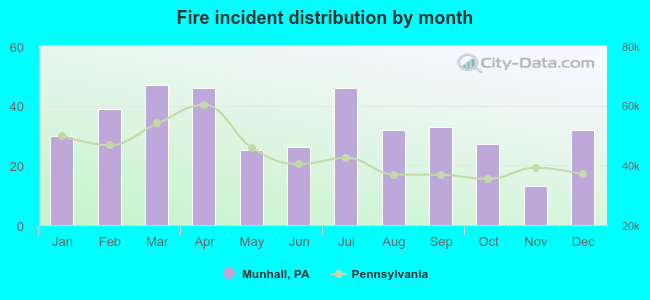 Based on the 396 fires from years 2006 - 2018 most fires (11.9%) took place during March, and the least (3.3%) in November.
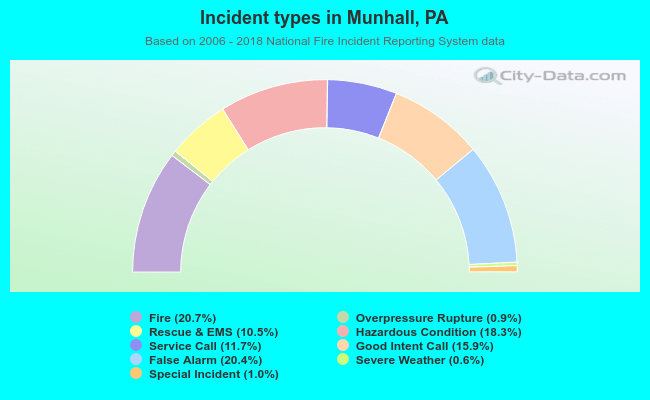 Out of all 1,909 cases reported during the years 2006 - 2018, the most belonged to the categories: Fire (20.7%), False Alarm (20.4%), and Hazardous Condition (18.3%).
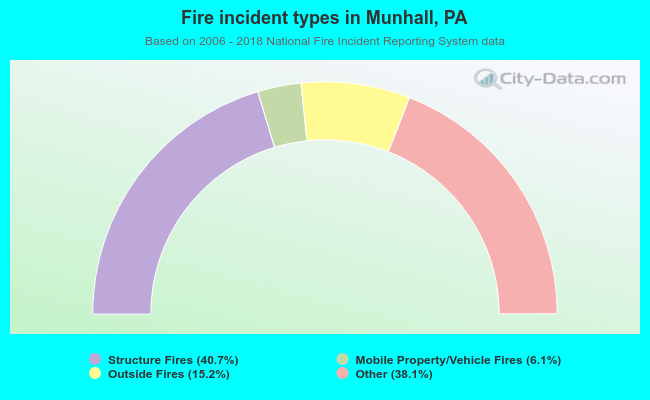 When looking into fire subcategories, the most reports belonged to: Structure Fires (40.7%), and Other (38.1%).