Penn Hills: Fire Incidents, Pennsylvania (PA)
Where are fire incidents reported in Penn Hills, PA
Something went wrong! Please refresh the page.
| Fire incidents reported | |
|---|---|
| Sreet name | Count |
| FRANKSTOWN RD | 148 |
| UNIVERSAL RD | 52 |
| RODI RD | 48 |
| SALTSBURG RD | 42 |
| JEFFERSON RD | 36 |
| ROBINSON BLVD | 24 |
| VERONA RD | 20 |
| BLACKADORE AVE | 18 |
| DUFF RD | 18 |
| LINCOLN RD | 16 |
| LONG RD | 16 |
| STOTLER RD | 16 |
| THOMPSON RUN RD | 16 |
| BALE DR | 14 |
| IDLEWOOD RD | 14 |
| LIME HOLLOW RD | 14 |
| MAIN ST | 14 |
| MILLTOWN RD | 14 |
| MT CARMEL RD | 14 |
| ALLEGHENY RIVER BLVD | 12 |
| BEULAH RD | 12 |
| CHASKE ST | 12 |
| GROVE RD | 12 |
| LEECHBURG RD | 12 |
| ORLAN PL | 12 |
| SYCAMORE DR | 12 |
| ALCOMA BLVD | 10 |
| CRESCENT HILLS RD | 10 |
| EVERGLADE DR | 10 |
| GRANDVIEW AVE | 10 |
| Other | 212 |
2004 - 2018 National Fire Incident Reporting System (NFIRS) incidents
- Incident types reported to NFIRS in Penn Hills, PA
- 89024.1%Fire
- 83722.7%Rescue & EMS
- 73419.9%Hazardous Condition
- 58415.8%False Alarm
- 46512.6%Good Intent Call
- 1253.4%Service Call
- 310.8%Severe Weather
- 170.5%Special Incident
- 60.2%Overpressure Rupture
- Fire incident types reported to NFIRS in Penn Hills, PA
- 54661.3%Structure Fires
- 16118.1%Outside Fires
- 13915.6%Mobile Property/Vehicle Fires
- 444.9%Other
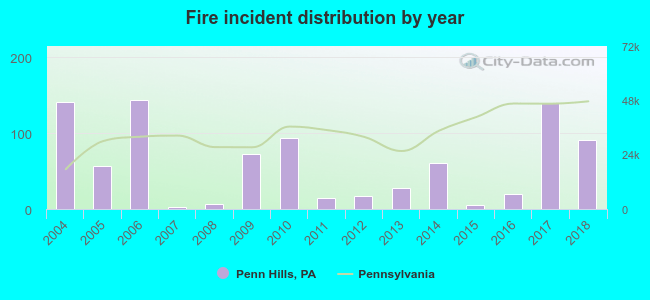 According to the data from the years 2004 - 2018 the average number of fire incidents per year is 59. The highest number of reported fire incidents - 143 took place in 2006, and the least - 2 in 2007. The data has a dropping trend.
The average number of yearly fire incidents per 10k residents in Penn Hills, PA compared to nearest cities:
(Note: Based on data for the last 3 years, including only cities with population 5,000 and above)
| Penn Hills: | 18.7 |
| Oakmont: | 27.5 |
| Wilkinsburg: | 31.6 |
| Forest Hills: | 31.9 |
| Fox Chapel: | 10.5 |
| Plum: | 29.4 |
| Monroeville: | 27.7 |
| Swissvale: | 58.0 |
| Turtle Creek: | 43.4 |
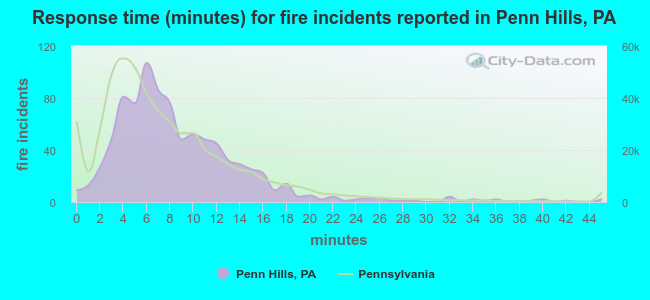 The median response time based on all reported fire incidents is 7 minutes. This is similar to the state median value.
The median response time in Penn Hills, PA compared to nearest cities:
(Note: Based on data for all years, including only cities with at least 500 fire incidents)
| Penn Hills: | 7 minutes |
| Monroeville: | 6 minutes |
| New Kensington: | 6 minutes |
| Murrysville: | 6 minutes |
| Pittsburgh: | 4 minutes |
| West Mifflin: | 7 minutes |
| McKeesport: | 5 minutes |
| Export: | 2 minutes |
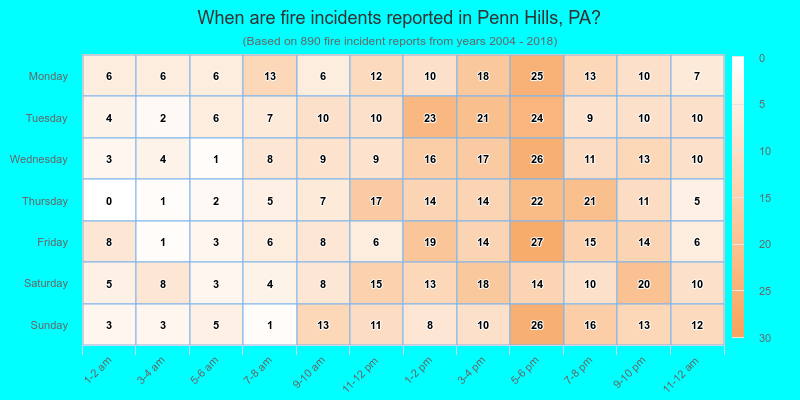
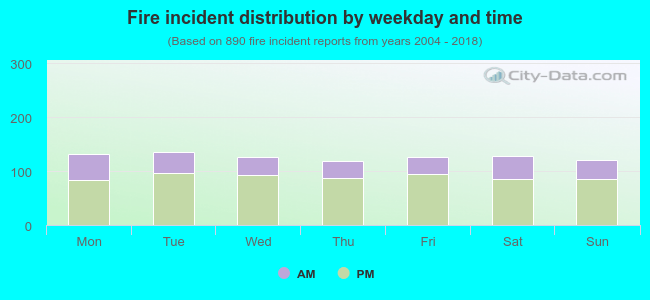 29.8% incidents where reported in the morning and 70.2% in the evening. The most fires (15.3%) took place on Tuesday, and the least (13.4%) on Thursday.
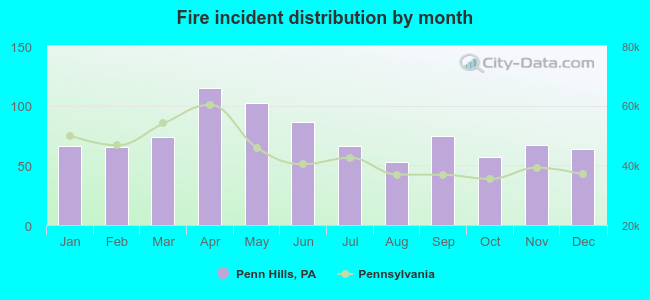 According to the 890 fire incident reports from years 2004 - 2018 most fires (12.9%) took place during April, and the least (6.0%) in August.
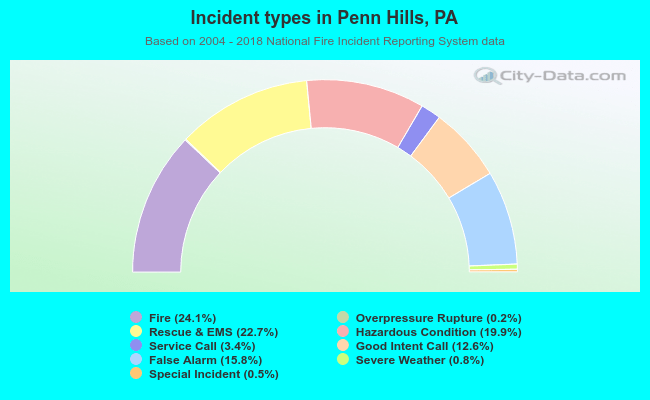 Out of all 3,689 cases reported during the years 2004 - 2018, the most belonged to the categories: Fire (24.1%), Rescue & EMS (22.7%), and Hazardous Condition (19.9%).
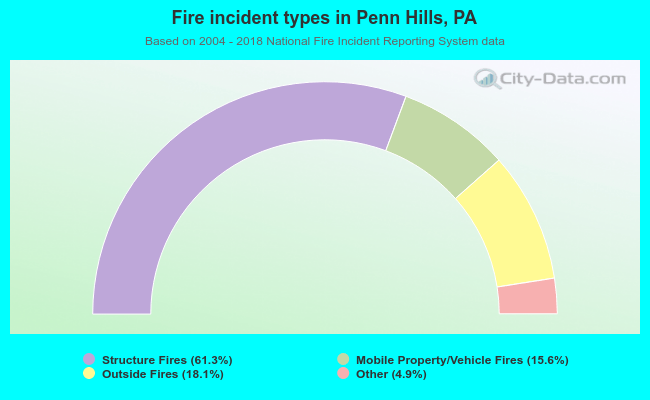 When looking into fire subcategories, the most reports belonged to: Structure Fires (61.3%), and Outside Fires (18.1%).